Excel: Statistical Process Control

Excel: Statistical Process Control
.MP4, AVC, 1000 kbps, 1280x720 | English, AAC, 128 kbps, 2 Ch | 1h 14m | 140 MB
Instructor: Curt Frye
.MP4, AVC, 1000 kbps, 1280x720 | English, AAC, 128 kbps, 2 Ch | 1h 14m | 140 MB
Instructor: Curt Frye
Learn how to analyze the accuracy and alignment of manufacturing processes using statistical tools. Veteran Excel trainer Curt Frye covers the three types of charts-P charts, C charts, and X-bar R charts-that are used to summarize the most common process metrics: proportion of defective output, number of defects, and variability of process outputs. He shows how to perform the analysis, plot the data, and interpret the results of each technique. He also how to examine processes from the customer's perspective using process capability analysis. Business analysts and support staff who help prepare documents, as well as executives and senior managers who might not have a statistical background, will use the skills in this course to analyze their organizations' processes and output.
Topics include:
Performing statistical analysis
Analyzing with P charts
Creating a modified P chart
Analyzing defects with C charts
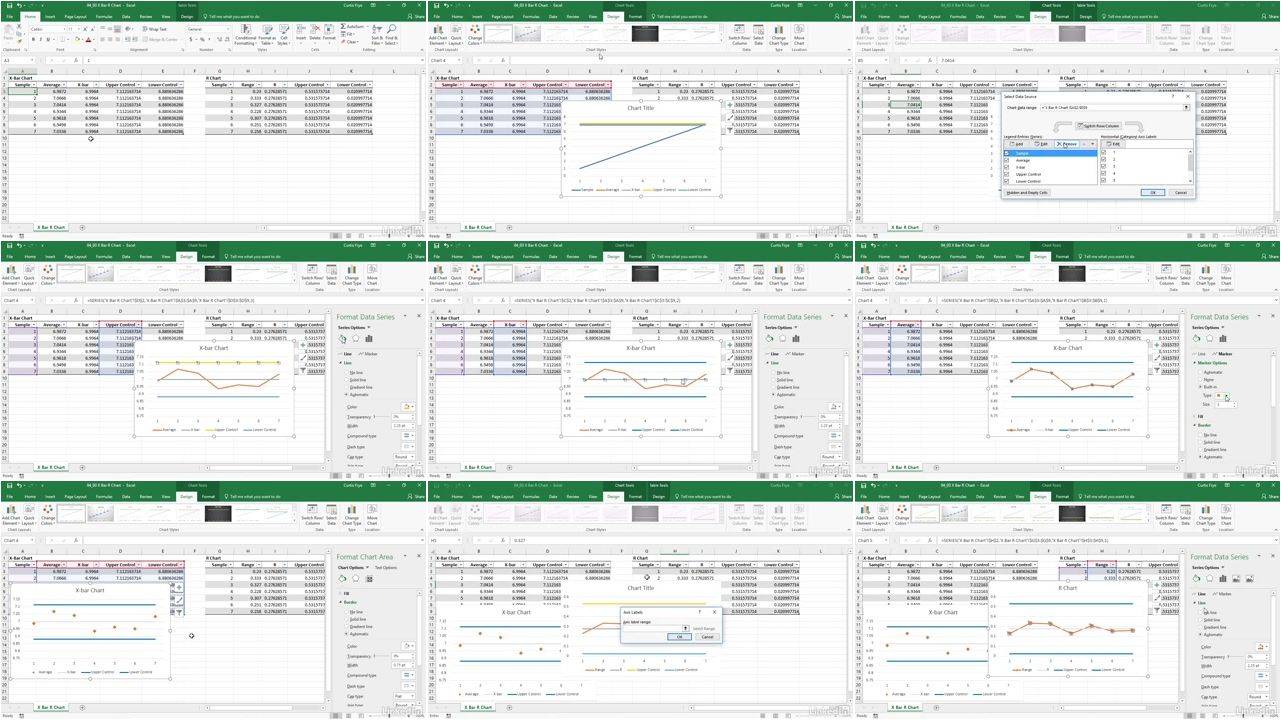
Analyzing variables with X-bar R charts
Performing process capability analysis
Excel: Statistical Process Control