


Advanced Spatial Data Visualization in Python
Advanced Spatial Data Visualization in Python
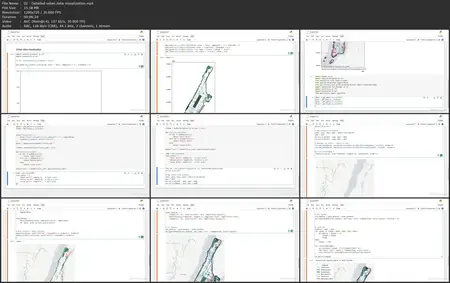
.MP4, AVC, 1280x720, 30 fps | English, AAC, 2 Ch | 1h 33m | 372 MB
Instructor: Milan Janosov, Ph.D.
.MP4, AVC, 1280x720, 30 fps | English, AAC, 2 Ch | 1h 33m | 372 MB
Instructor: Milan Janosov, Ph.D.
Explore the cutting-edge field of spatial data visualization with Python. Join Milan Janosov, the founder of Geospatial Data Consulting, for hands-on experience creating interactive, 3D, and temporal map visualizations that bring spatial stories to life.
Milan demonstrates vector and raster visualization techniques, showing how to build a complete framework using Matplotlib and Datashader for urban and large-scale spatial data. Learn how to create interactive maps with Plotly and Folium, and explore 3D mapping techniques using Matplotlib, Plotly, and pydeck to represent spatial geometries in three dimensions. Finally, discover temporal visualizations—static, animated, and interactive—for mapping spatiotemporal datasets.
Designed for data scientists and geospatial practitioners, this advanced course emphasizes real-world applications and practical strategies for evaluating and selecting visualization techniques for different data types and engagement needs.
Learning objectives
- Apply foundational visualization techniques to create both vector and raster maps using Python libraries such as Matplotlib and Datashader.
- Implement interactive mapping solutions using multiple frameworks (Plotly, Folium) to create engaging geospatial visualizations that allow user exploration.
- Design effective 3D geospatial visualizations using various tools to represent complex spatial relationships and terrain data.
- Develop animated and interactive temporal visualizations to effectively communicate spatial data changes over time.
- Evaluate and select appropriate visualization techniques and tools based on different spatial scales, data types, and intended audience engagement needs.
Advanced Spatial Data Visualization in Python
