Debugging Sites Using Chrome DevTools
Debugging Sites Using Chrome DevTools
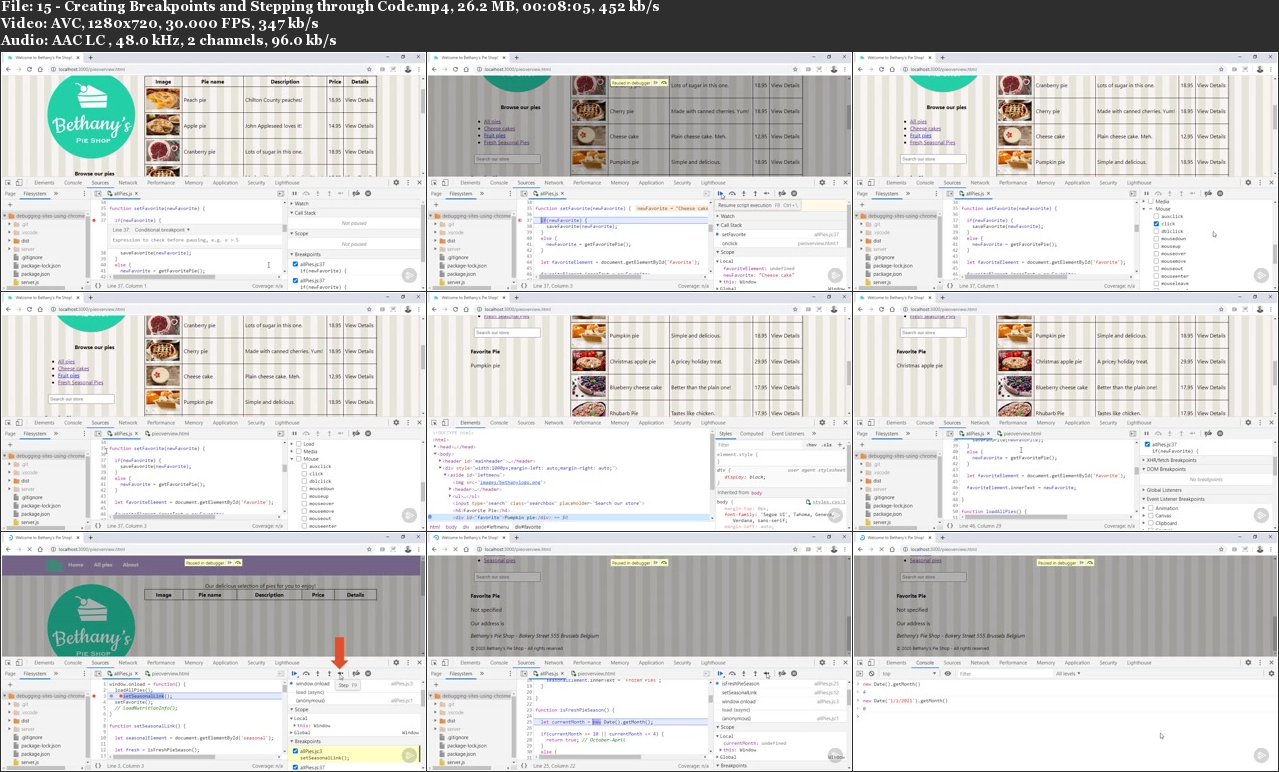
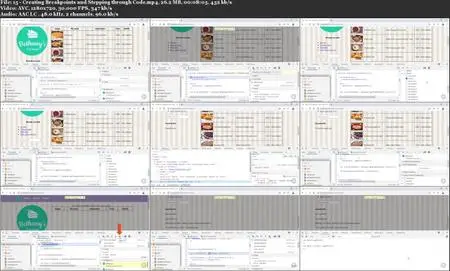
.MP4, AVC, 1280x720, 30 fps | English, AAC, 2 Ch | 1h 46m | 298 MB
Instructor: Brice Wilson
.MP4, AVC, 1280x720, 30 fps | English, AAC, 2 Ch | 1h 46m | 298 MB
Instructor: Brice Wilson
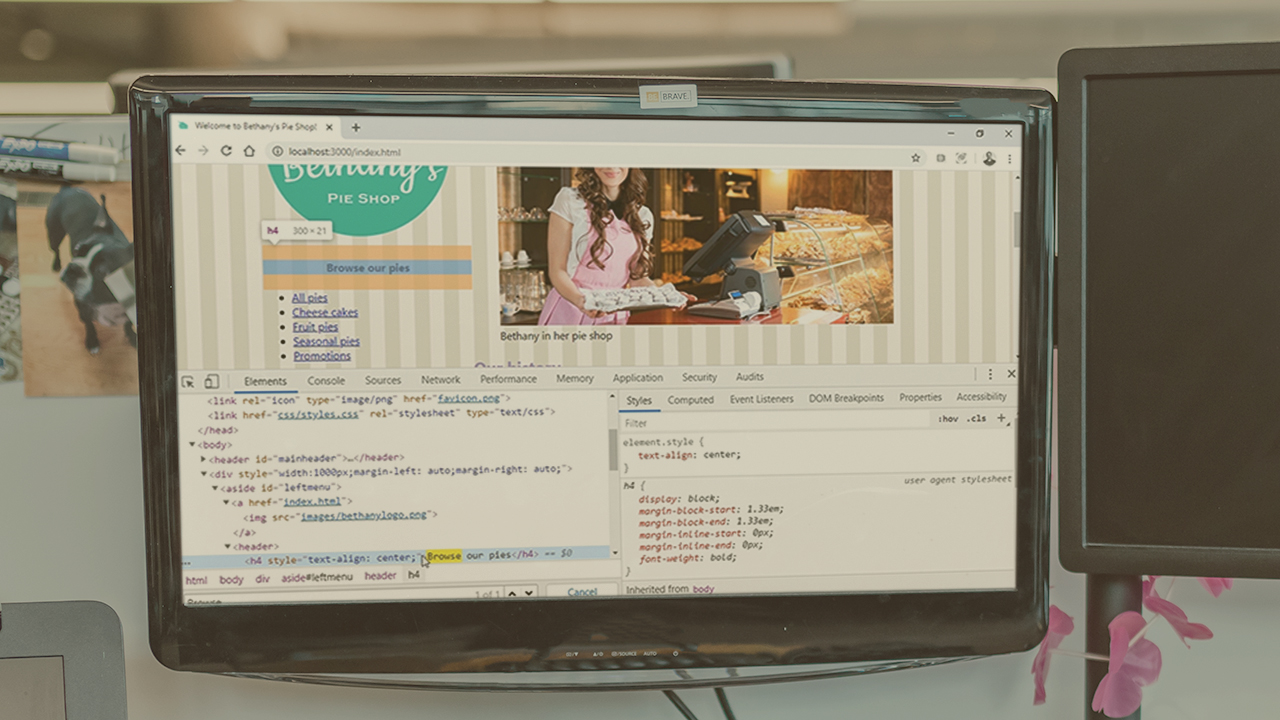
Google Chrome ships with a powerful set of tools to help developers debug web sites. This course will teach you how to use those tools to troubleshoot and fix problems in a site's HTML, CSS, and JavaScript.
Debugging client-side web applications can be difficult because they involve a complex mix of HTML, CSS, and JavaScript while also storing data on the client and constantly communicating with a web server. In this course, Debugging Sites Using Chrome DevTools, you'll learn how to use the powerful set of tools included with Chrome to quickly diagnose and fix problems in your client-side applications. First, you'll learn how to examine and edit both the structure and style of a site to make sure your designs are being implemented correctly. Next, you'll discover how to fully harness the power of the browser console to log output, execute JavaScript, and troubleshoot problems. Finally, you'll explore how to step through and debug JavaScript code right in the browser and save fixes back to your development environment. When you're finished with this course, you'll have the skills needed to confidently and efficiently debug modern client-side web applications.
Debugging Sites Using Chrome DevTools