Using Linux Performance Tools

Using Linux Performance Tools
MP4 | Video: AVC 1280x720 | Audio: AAC 44KHz 2ch | Duration: 1.5 Hours | 571 MB
Genre: eLearning | Language: English
MP4 | Video: AVC 1280x720 | Audio: AAC 44KHz 2ch | Duration: 1.5 Hours | 571 MB
Genre: eLearning | Language: English
Move from basic Linux administration to advanced in this course that details how to monitor, profile, and trace Linux systems and applications. Linux expert Sasha Goldshtein shows you how to run basic performance checklists to get a reading of high-level system performance. You'll discover ways to diagnose specific issues such as high CPU load, excessive I/O, and slow network requests; as well as gain a solid understanding of the Linux system infrastructure that makes tracing and profiling possible. The course is designed for application developers, system administrators, and SREs with some Linux system administration experience and a basic understanding of OS concepts like threads, I/O operations, and memory.
Master the ability to identify overloaded resources on a Linux system
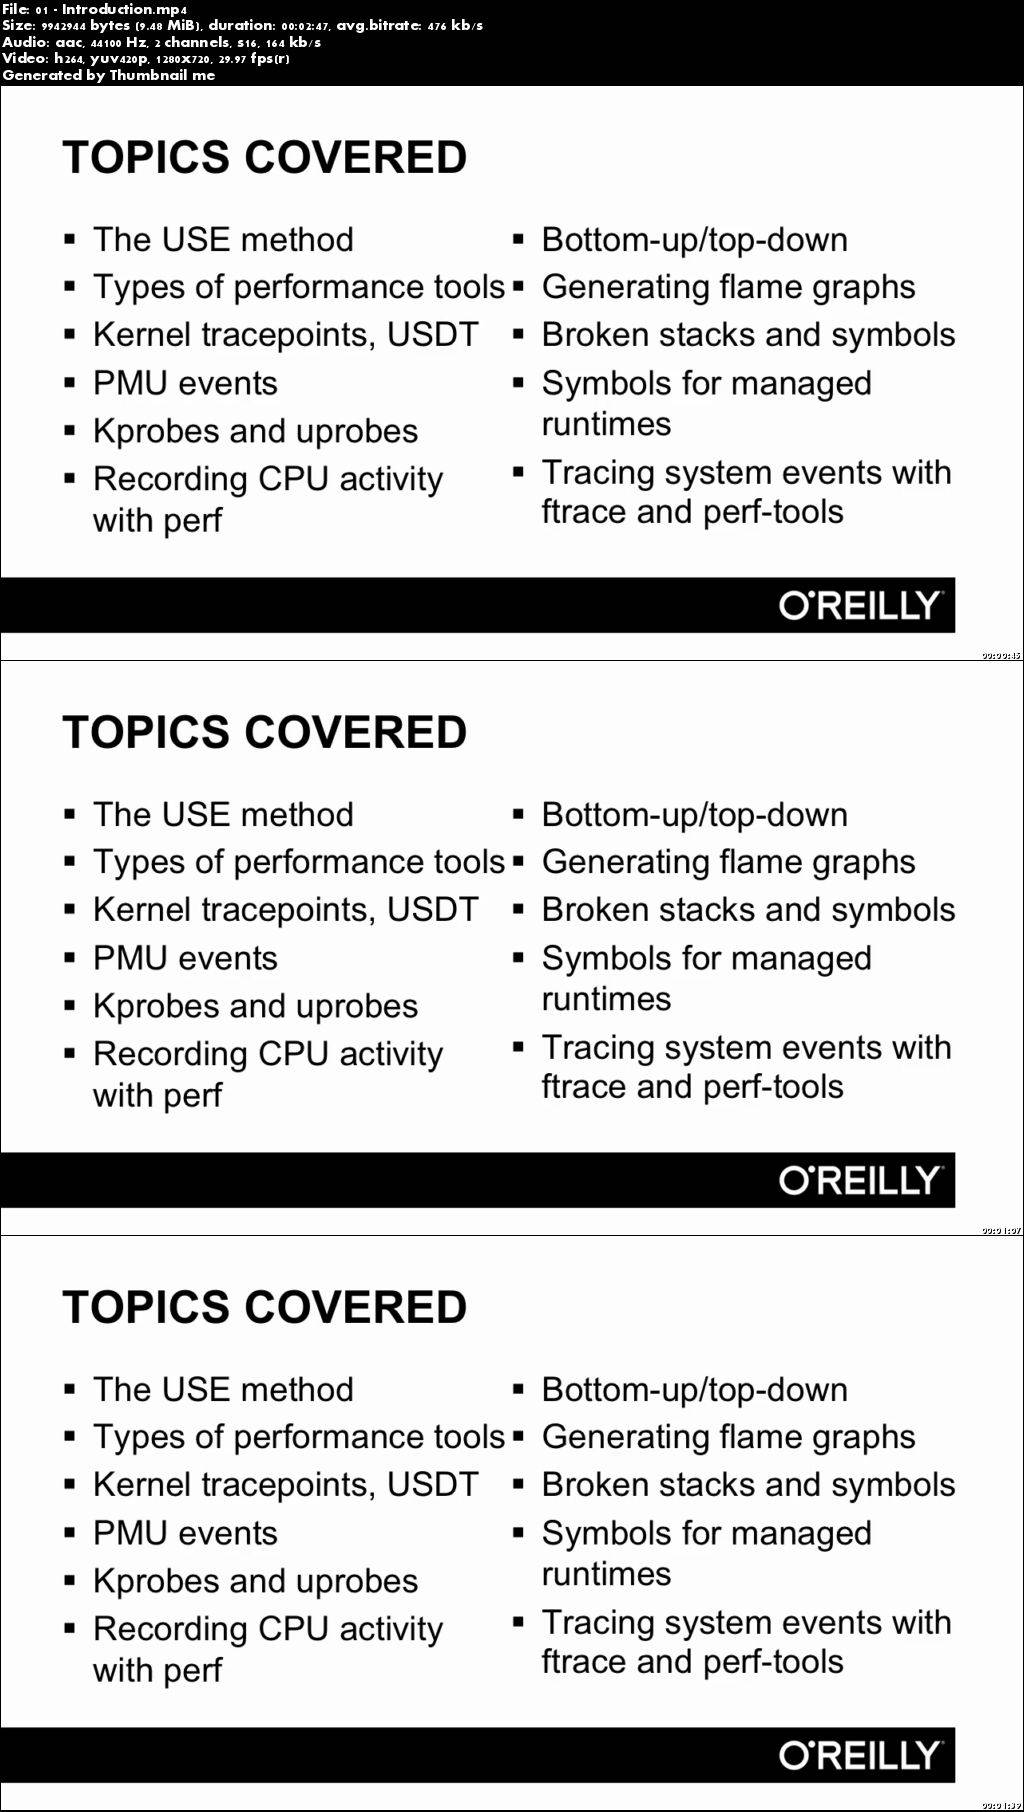
Learn about the Utilization Saturation and Errors (USE) methodology for performance investigation
Explore Linux performance information sources such as kprobes and uprobes
Understand how to improve CPU utilization by doing careful profiling and identifying bottlenecks
Gain the ability to visualize stack reports using flame graphs
Learn about tracing I/O, scheduling, and other system events using ftrace and perf tools
Discover methods for analyzing CPU performance at the process, module, and function level
Understand how to trace slow disk accesses and file system operations
Using Linux Performance Tools