Data Visualizations with Power BI in Excel 2013

Data Visualizations with Power BI in Excel 2013
MP4 | Video: AVC 1280x720 | Audio: AAC 44KHz 2ch | Duration: 2 Hours 43M | 633 MB
Genre: eLearning | Language: English
MP4 | Video: AVC 1280x720 | Audio: AAC 44KHz 2ch | Duration: 2 Hours 43M | 633 MB
Genre: eLearning | Language: English
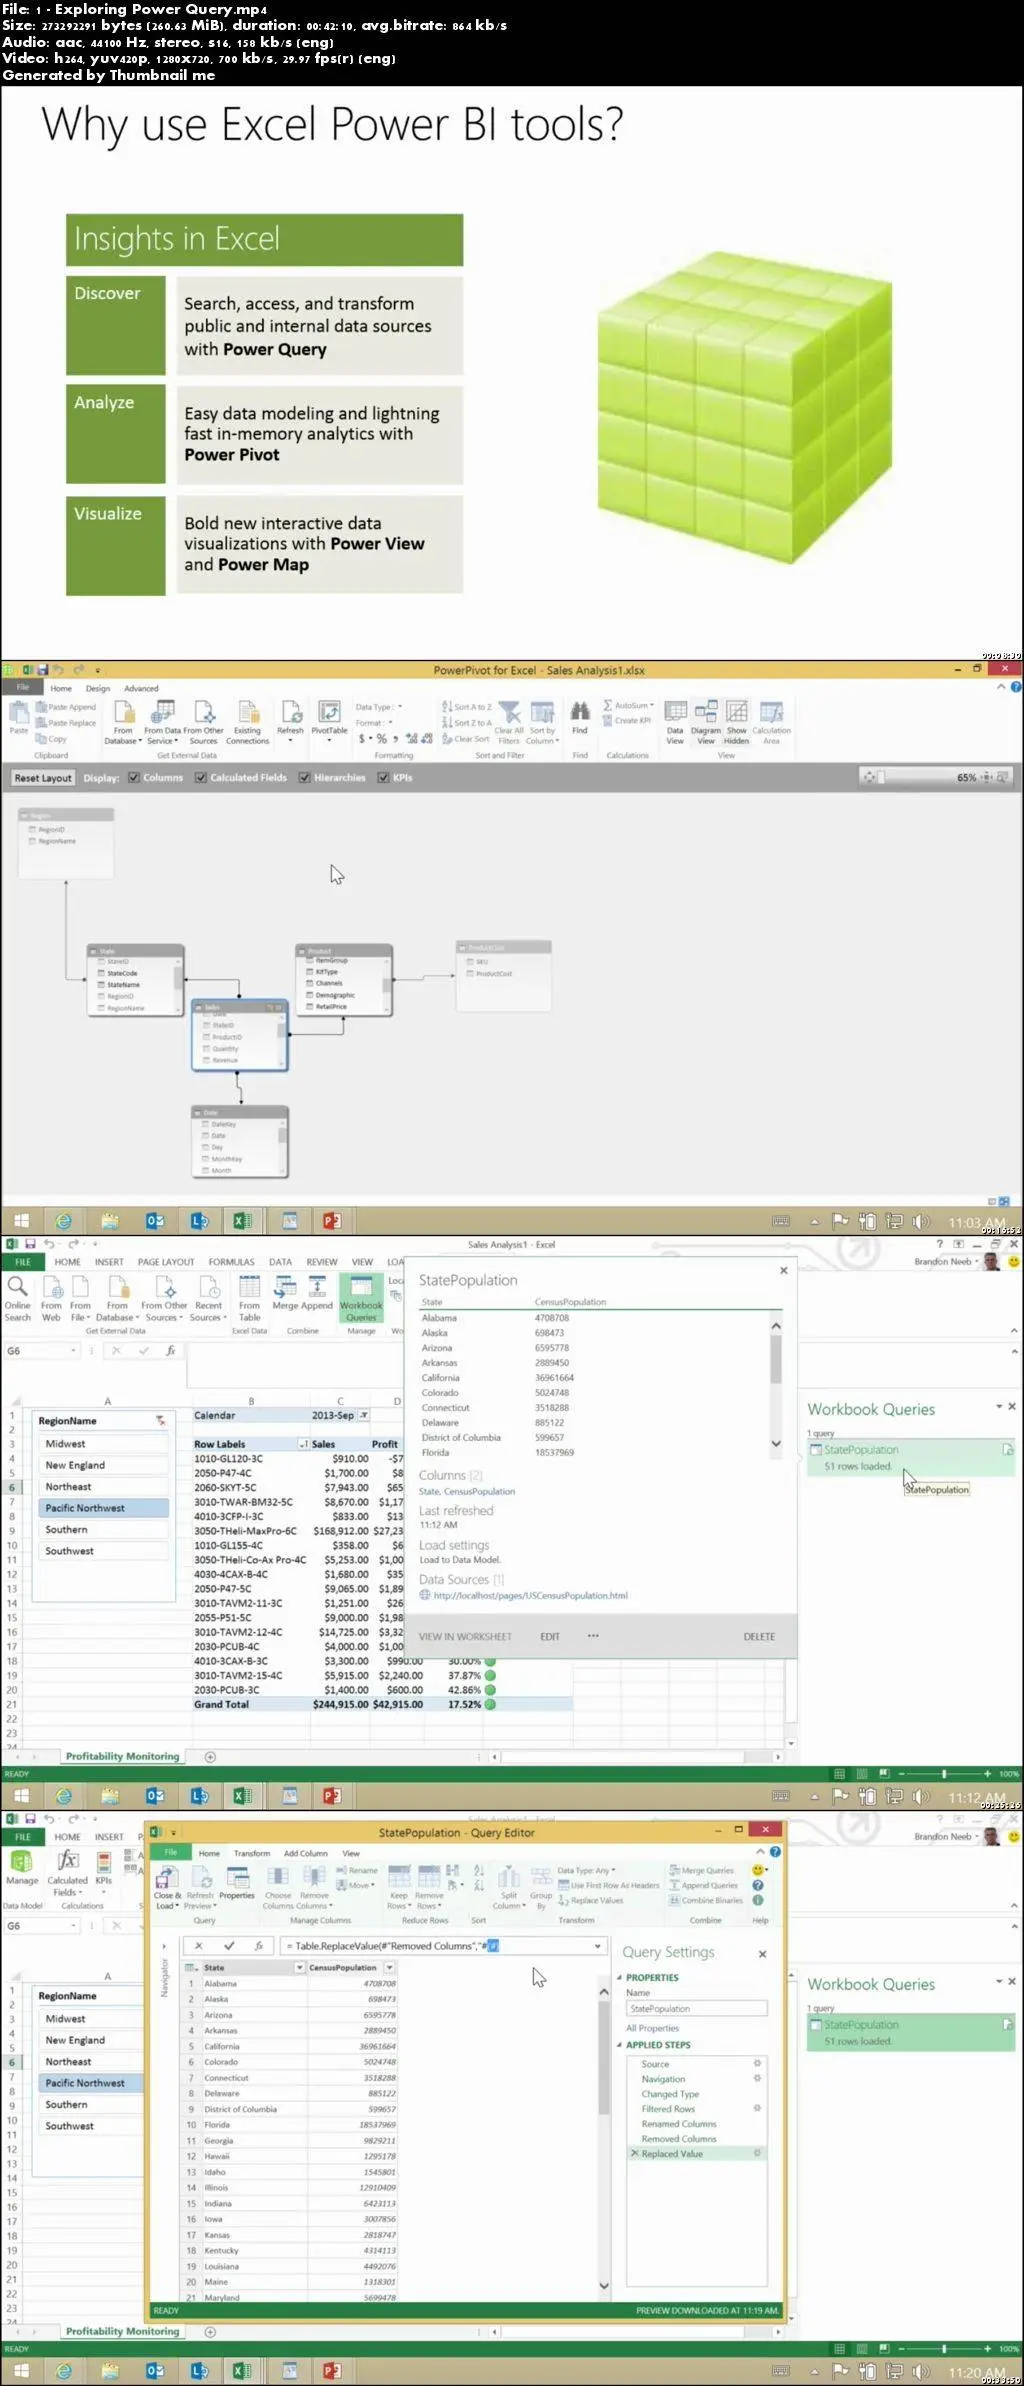
Need help making sense of tons of information? Are you interested in data visualization? Access to business intelligence (BI) has become a priority for many companies. Power BI in Excel 2013 provides an expansive set of features that enable dynamic reports and presentations of the most relevant data.In this course, see informative demos on creating a PowerPivot data model for Excel, use Power Query to explore the data, create a visually appealing Power View sheet, and use Power Map to integrate the data with Bing Maps to create a video presentation.
Data Visualizations with Power BI in Excel 2013