

Introduction to Data Visualization with Matplotlib

Introduction to Data Visualization with Matplotlib
MP4 | Video: AVC 1280x720 | Audio: AAC 44KHz 2ch | Duration: 1 Hour | 175 MB
Genre: eLearning | Language: English
MP4 | Video: AVC 1280x720 | Audio: AAC 44KHz 2ch | Duration: 1 Hour | 175 MB
Genre: eLearning | Language: English
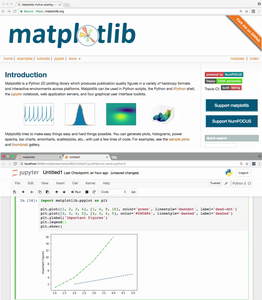
Get started creating charts with the Python library, matplotlib, an industry standard data visualization library. Matplotlib provides a way to easily generate a wide variety of plots and charts in a few lines of Python code. It is an open source project that can be integrated into Python scripts, jupyter notebooks, web application servers, and multiple GUI toolkits. Whether you are exploring sample data available on the internet, or your own business data, learning matplotlib is a great place to start your data visualization journey.
What you'll learn
Introduction to the Python matplotlib library
Uses and reasons behind the selection of a particular chart type
This course will introduce the user to the concepts of data visualization, which will help them to better understand business drivers and data trends
Explores graph customization to further enhance data reporting and communicating meaning
Introduction to Data Visualization with Matplotlib
