How to Produce Prediction Map in GIS With ArcGIS and Excel?

How to Produce Prediction Map in GIS With ArcGIS and Excel?
MP4 | Video: AVC 1280x720 | Audio: AAC 44KHz 2ch | Duration: 1.5 Hours | Lec: 18 | 307 MB
Genre: eLearning | Language: English
MP4 | Video: AVC 1280x720 | Audio: AAC 44KHz 2ch | Duration: 1.5 Hours | Lec: 18 | 307 MB
Genre: eLearning | Language: English
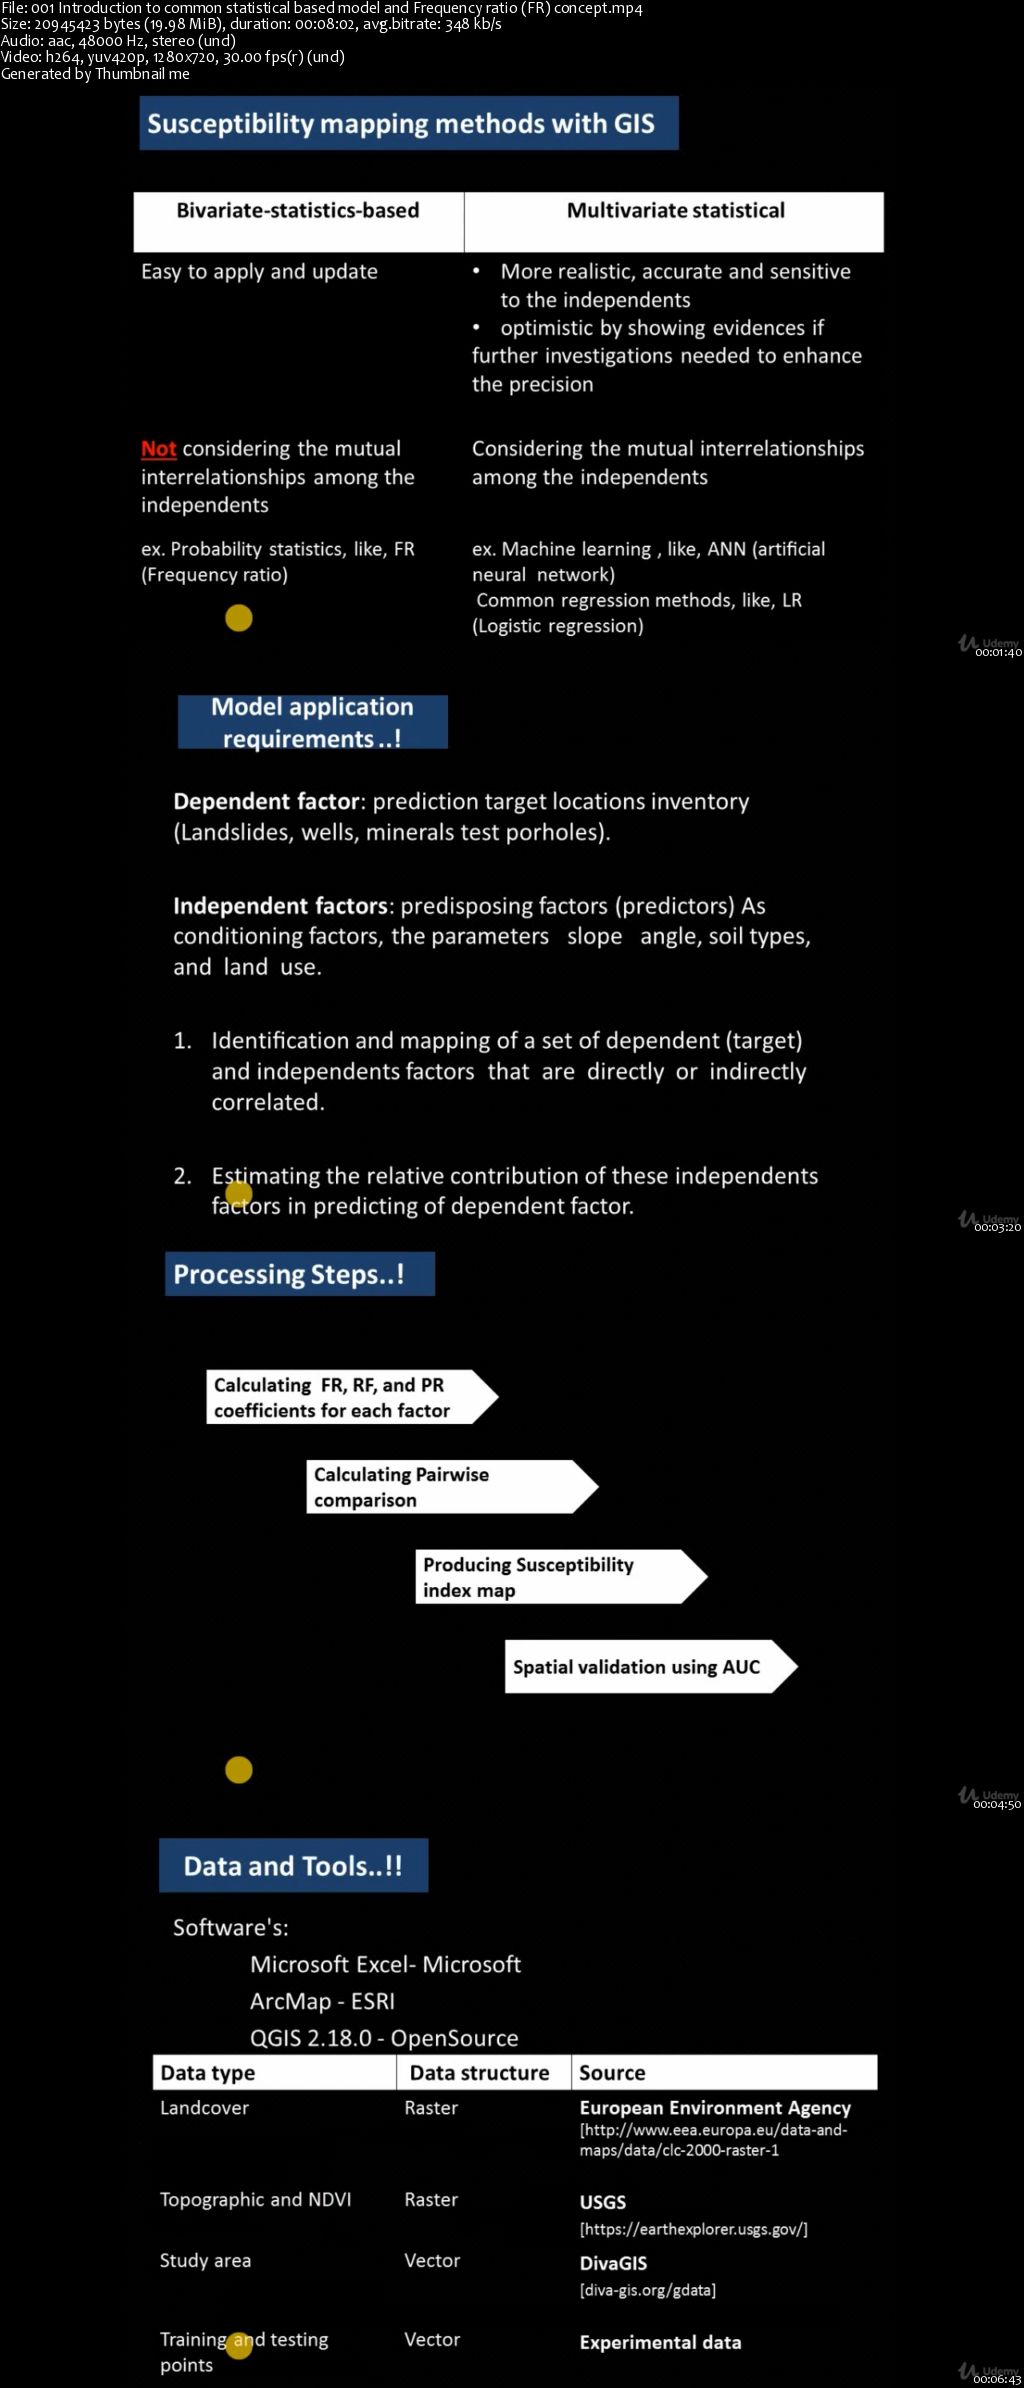
Step By Step Guide To Produce and Validate Hazards Prediction Map With ArcGIS and Excel Using Frequency Ratio Model
Since the late 1980s, the widely popular and efficient geographic information system (GIS) has facilitated the development of new machine learning, data-driven, and empirical methods that reduce generalization errors.
In the this course, i have shared a famous and solid bivariate technique (Frequency ratio), to help you start your first prediction map using ArcMap and Excel only.
I will explain the spatial correlation between; prediction factors, and the dependent factor. Also, how to find the autocorrelations between; the prediction factors, by considering their prediction importance or contribution. Finally, I will Produce susceptibility map using; Microsoft Excel and ESRI ArcGIS only. Model prediction validation will be measured by most common statistical method of Area under the curve (AUC).
What you’ll learn
You’ll have my continuous support, taking your hand step-by-step to develop your first high quality map using real data
Writing a journal article, MOST WELCOME, I am available to help you to produce a scientific article qualified for peer review acceptance
I will be with you to interpret the results, we will discuss about the technical issues as well as how to make your results meaningful
Free access to all my previous publications techniques and methods: Search for "Omar Althuwaynee on Researchgate"

How to Produce Prediction Map in GIS With ArcGIS and Excel?