A Data Visualization Guide For Management Consultant

A Data Visualization Guide For Management Consultant
MP4 | Video: AVC 1280x720 | Audio: AAC 44KHz 2ch | Duration: 2.5 Hours | Lec: 51 | 229 MB
Genre: eLearning | Language: English
MP4 | Video: AVC 1280x720 | Audio: AAC 44KHz 2ch | Duration: 2.5 Hours | Lec: 51 | 229 MB
Genre: eLearning | Language: English
The McKinsey way to create the right chart for the right data
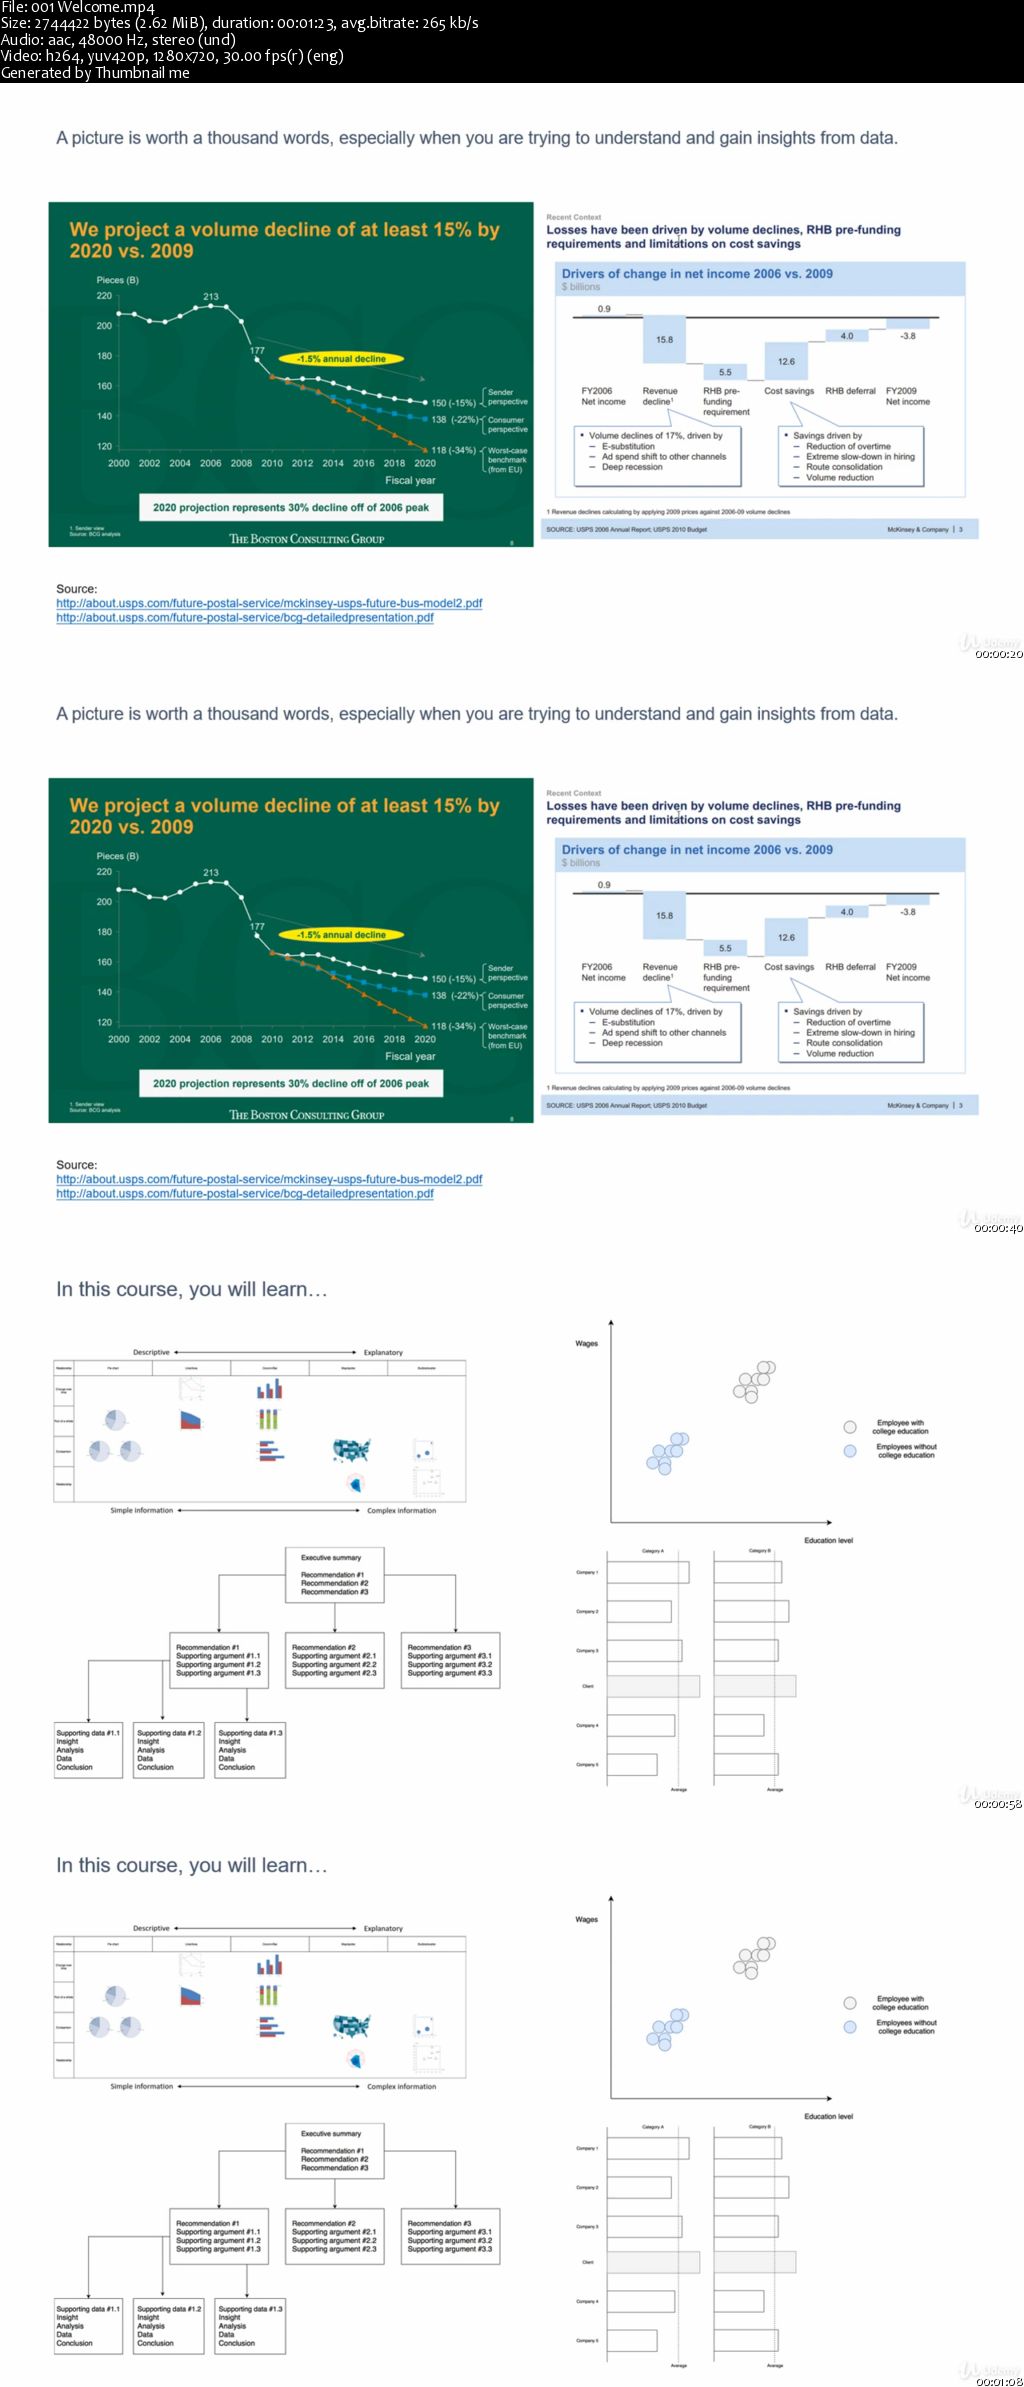
A picture is worth a thousand words - especially when you are trying to understand and gain insights from data. It is especially relevant when you are trying to find relationships among thousands or even millions of variables and determine their relative importance.
Organizations of all kinds generate huge amounts of data each minute, hour and day. Everyone – including executives, departmental decision makers, call center workers, and employees on production lines – hopes to learn things from collected data that can help them make better decisions, take smarter actions and operate more efficiently.
If your data has hundreds of rows, one of the best ways to discern important relationships doesn’t depend on the software you are using, but your mindset. Without a clear roadmap to transform raw data into charts, any technology would be not possible to help you out.
In this course, I'll share with you the fundamentals of creating a management consulting chart. I'll talk about how to find and research the data that you want to build data visualization, how to come up with and optimize the chart types, and the importance of delivering key messages and storyline. I'll then focus on how to design a chart in detail, as well as color coding that can help you understand just what you're getting back from colors. Finally, I will let you know the essential checklist to make sure everything you've done is good to go.
If you're ready to make sure that you choose the right chart for the right data to delivery effective data visualization, then let's get started.
A Data Visualization Guide For Management Consultant