Financial Data Analysis using Excel 2013
Financial Data Analysis using Excel 2013
MP4 | Video: 1280x720 | 60 kbps | 44 KHz | Duration: 6 Hours | 1.44 GB
Genre: eLearning | Language: English
MP4 | Video: 1280x720 | 60 kbps | 44 KHz | Duration: 6 Hours | 1.44 GB
Genre: eLearning | Language: English
A Practical course explores the easy solutions to accurately analyze economic inputs and to financial data analysis
In this ever-changing business environment, being able to accurately analyze economic inputs is a critical skill for business users. Microsoft Excel comes with several built-in financial functions which perform many of the commonly used financial calculations.
Whether you are new to Excel or an advanced user, Grey Campus Excel courses will cover what you need to know to become an expert in using Microsoft Excel as a sophisticated Financial Analysis tool.
This is a practical course that explores the easy solutions to financial data analysis and thus helps in increasing efficiency of business users. It has been designed for professionals who wish to explore the practical usage of advanced Excel functions with financial data.
At the end of the course, participants would learn/use/acquire the following techniques/knowledge:
Appreciate some of the frequently used functions in Excel
Explore the protection features of Excel
Work with conditional structures and related functions
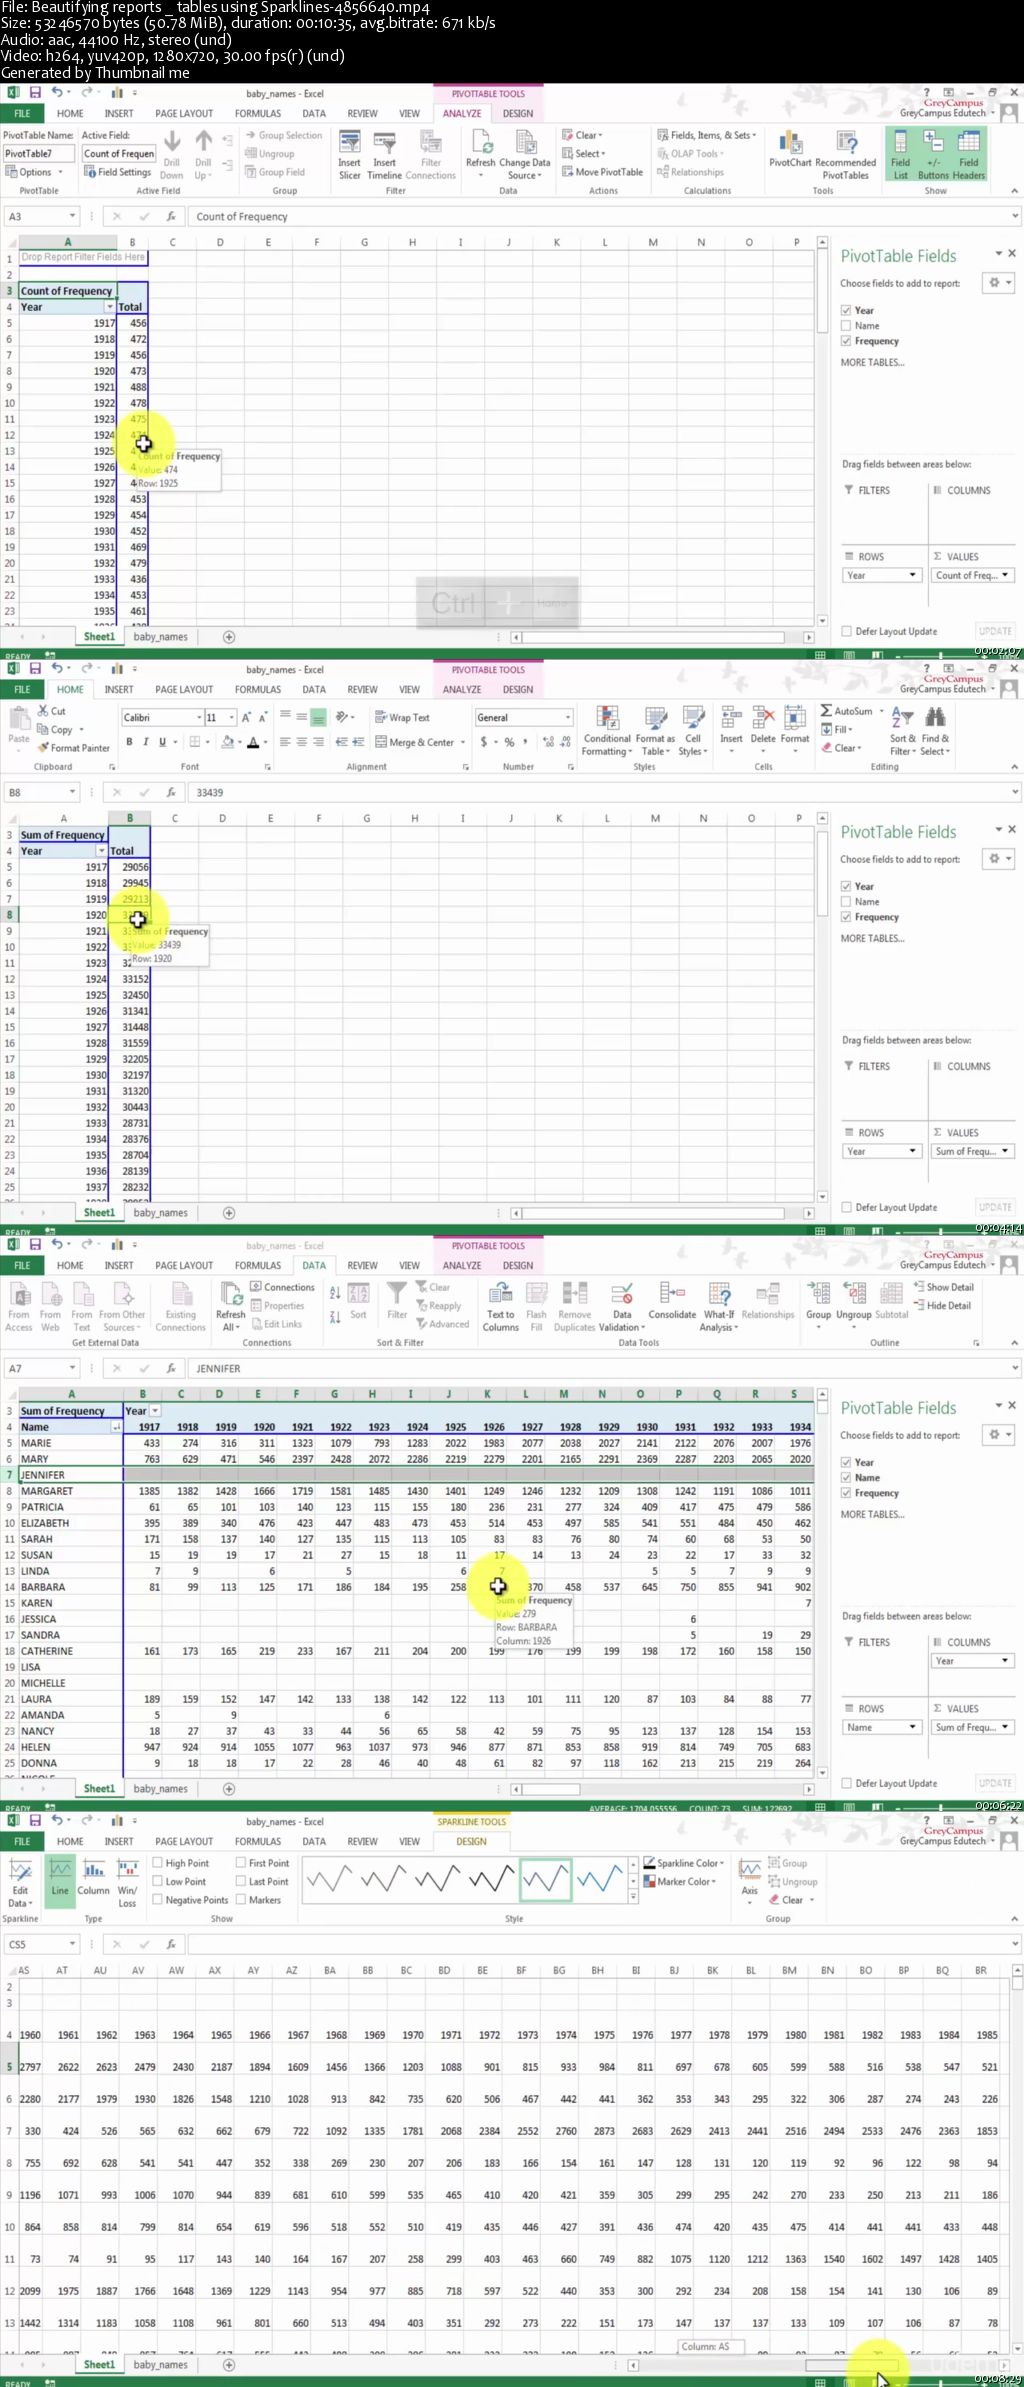
Explore the various components of Pivot Tables and Charts
Implement Slicers and Sparklines to build interactive dashboards
Explore Financial functions of MS Excel
Understand co-relation of financial data and forecast related values
Financial Data Analysis using Excel 2013