

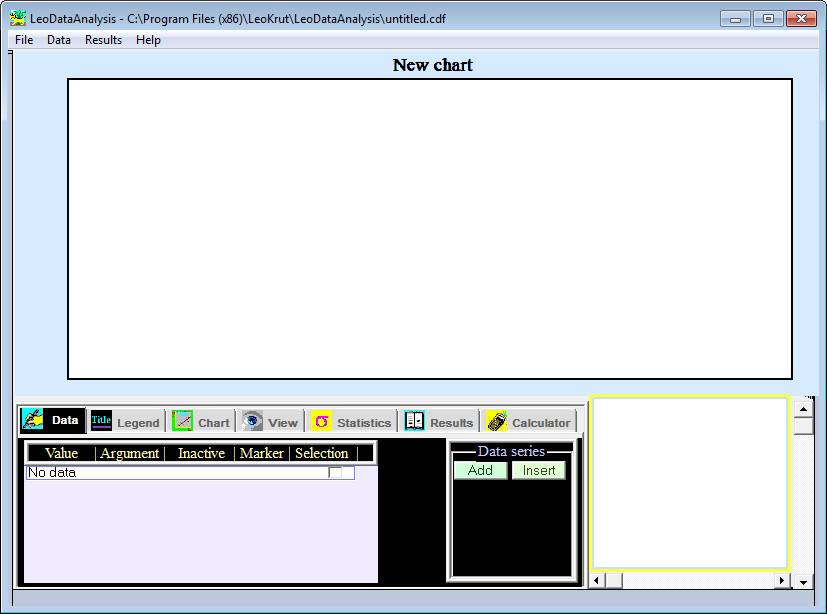
LeoDataAnalysis 17.4
LeoDataAnalysis 17.4 | 1.5 Mb
Data visualization, statistical analysis and modeling software. Scientific and educational software application LeoDataAnalysis is targeted for the broadest range of customers from students till scientists and data analysts. It has very mild limits on the size of data to operate.
Main features:
Import Data Series:
Copy/paste from MS Excel or other table like sources.
Read text file.
Analyze image manually or automatically and import data in numerical form.
Read from MS Access database.
Data Modification:
Ability to analyze more then one data series (tables) simultaneously.
Modify values of parameters in data series by user defined formulas or by incorporated simple schemes.
Purge data outside defined ranges.
Visualization of data and statistical analysis:
Calculating matrix of correlations for all parameters in data series and visually presenting them as a table of x-y charts.
Building histograms of variable distributions comparing them with Student, Erlang and Poisson probability densities. There is an option to calculate distributions conditioned to other parameters as well a probability that selected data is not random subset. The state of art algorithm permits automatically find conditions corresponded to most non-incidental subset of data.
X-Y chart of two variables with an ability to implement a variety of curve fitting schemes:
like least square approximation, fit wit custom formula, harmonic analysis and others.
Distribution of two variables presents as three dimensional histogram or of iso-surfaced color map.
A value as function of two parameters are presented in form perspective projection on the screen of its three dimensional coordinates with ability to change user point of view.
Linear and parabolic multivariate regression more then two arguments.
Near neighbors method for multivariate estimation of value on the premise that closest in multidimensional space points have alike values.
Local search in multidimensional space best fitting coefficients for user defined formula of two or more arguments.
Calculation of probability (score) for chosen variable (considered as a response) to be more then given value for defining the pool of prospective customers in market research and followed advertising campaign.
Results:
There is an option to instantly create a MS Word document or HTML page with a result chart and results of statistical analysis.
A calculation of value for the given set of arguments for active statistical scheme when available (few logical exclusions applied).
Usage of active statistical scheme to produce fitting values for array of arguments contained in text file. There is an option to sort results and save them as a text file that can be used for prediction including selection of most perspective leads (consumers).
Operating System: Windows 7, 8/8.1, 10
Home Page - http://leokrut.com/