

MedCalc 14.8.1
MedCalc 14.8.1 | 28 MB
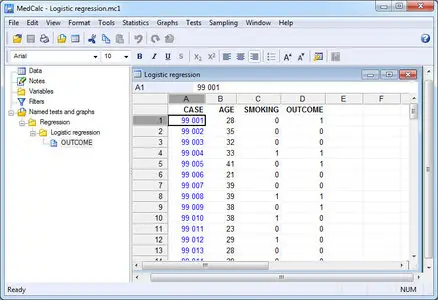
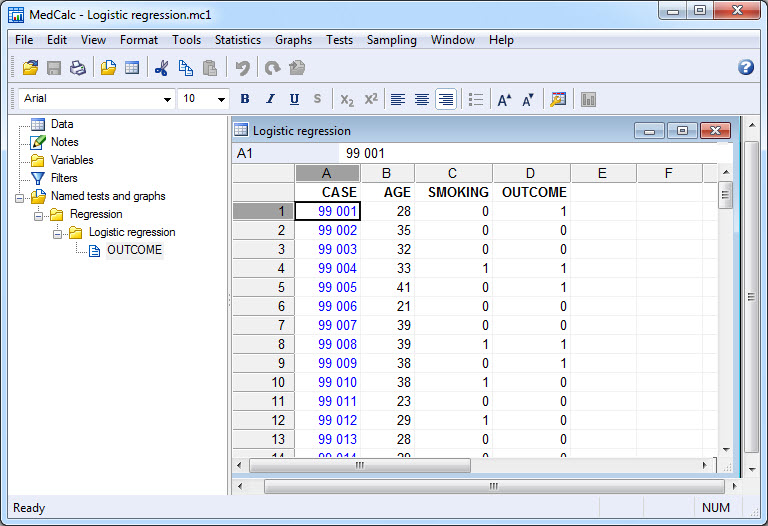
MedCalc is a complete statistical program for Windows designed to closely match the requirements of biomedical researchers. It is fast, user-friendly and reliable. MedCalc is the most user-friendly software for Receiver Operating Characteristic curve (ROC curves) analysis. The MedCalc ROC module includes comparison of up to 6 ROC curves. The software also includes Bland & Altman plot, Passing and Bablok and Deming regression for method comparison studies.
MedCalc for Windows description
• Data management
• Integrated spreadsheet with 16384 columns and up to 100000 rows.
• Correct handling of missing data.
• Outliers can easily be excluded.
• Built-in WYSIWYG text editor.
• Imports Excel, Excel 2007, SPSS, DBase and Lotus files, and files in SYLK, DIF or plain text format.
• Easy selection of subgroups for statistical analysis.
Documentation
• Comprehensive help file.
• Manual in PDF format (go to download area).
• Complete HTML manual on MedCalc web site.
• Context help in dialog boxes.
ROC curve analysis
• Area under the curve (AUC) with standard error, 95% confidence interval, P-value. Offers choice between methodology of DeLong et al. (1988) and Hanley & McNeil (1982, 1983).
• List of sensitivity, specificity, likelihood ratios, and positive and negative predictive values for all possible threshold values.
• ROC curve graph with 95% Confidence Bounds.
• Threshold values can be selected in an interactive dot diagram with automatic calculation of corresponding sensitivity and specificity.
• Plot of sensitivity and specificity versus criterion values.
• Interval likelihood ratios.
• Comparison of up to 6 ROC curves: difference between the areas under the ROC curves, with standard error, 95% confidence interval and P-value.
• Sample size calculation for area under ROC curve and comparison of ROC curves.
• Go to the ROC curve analysis section of the MedCalc manual for more information on ROC curve analysis in MedCalc.
Graphs
• Lots of graphs, see Graph gallery.
• Data point identification in graphs.
• Draw text boxes, lines, arrows and connectors.
• Name, save and recall graphs and statistics.
• Statistical info in graph windows.
• Save graphs as BMP, PNG, GIF, PCX, JPG or TIF files, or as PowerPoint slides (*.pptx).
System requirements
• PC with Windows XP, Windows Server 2003, Windows Vista, Windows 7 or Windows 8 (32-bit and 64-bit versions).
• 512 Mb of memory.
• 20 Mb free space on the hard disk.
What's New in This Release:
Added comparison of regression lines in results section of Regression.
Added Homogeneity of regression slopes in results section of Analysis of covariance.
Added the AUC (Area under the ROC curve) in the results of Diagnostic test (2x2 table).
Corrected a problem in the calculatation of BCa bootstrap confidence intervals in ROC curve analysis.
Changed the method for calculation of Kendall's Tau correlation coeffcient from percentile bootstrap to BCa bootstrap confidence intervals.
Changed the random number generator used in bootstrapping to the Mersenne twister (implementation MT19937) (Matsumoto & Nishimura, 1998).
Some other minor improvements and bug fixes
New version numbers:
Starting August 2014, the MedCalc version number has been revised. The new version number consists of a year and month number, and a third number which is a minor revision number.
Home Page - http://www.medcalc.org
No more mirror please!