

ContourCube ActiveX 4.0.0.4

ContourCube ActiveX 4.0.0.4 | 20,4 MB
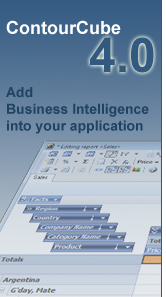
Add Business Intelligence functionality to your applications. ContourCube brings embeddable interactive reporting, data analysis and information delivery technology to Windows and web-based business and statistical solutions. It lets user interact with data: slice and dice, pivot, drill down and roll up with sub-second response times and without additional OLAP server. ContourCube offers rich palette of business-oriented functions, powerful and easy formula language, and a range of new reporting techniques with innovative approach to report distribution.
Contour Components Ltd is happy to announce the new major release of its cutting-edge OLAP component, ContourCube 4.0, the ultimate reporting component for businesses of all kinds. Years of development now turned into the powerful new features, necessary for business reporting.
Dimensions Tree View
No more need of horizontal scroll bar under the dimensions area – you will see figures in the table even when there are a number of dimensions to the left. Their convenient tree-like presentation will make your data more comprehensive and its analysis easier and faster. If you prefer the old classic pivot table view, it is still possible to switch the appearance with a single property in ContourCube component.
Filtering Dimensions by Fact Values
A must-have feature for any sales- and market-analysis application. Top ten best-seller products in the last quarter? Items that bring over 5% profit? All this can be seen by filtering your report by the values of facts in the table.
“Total-Including” Reports
Indespensable for statistics. When your source data contains aggregates and only a few detail items, when you want to display given totals instead of calculating them, ContourCube's “total-including” report configuration is what you need. In conjunction with the Unbalanced Hierarchy feature, this makes your reports ideal for statistical agencies and governments of any level.
Unbalanced Hierarchy
One of the most important needs in business data analysis is to visualize real-life irregular structures in a conventional manner. This is now achievable with ContourCube's unbalanced hierarchy of dimensions. It allows you display as much detail as there are in the source, without extra empty items that were added everywhere just because they are not empty in a couple of source data records.
Hierarchy Objects
Since a lot of important analytical algorithms only have sense in certain known field configurations, it is a good idea to consider such configurations unbreakable. This is what Hierarchy objects have been conceived for in ContourCube 4.0. Now you don't have to care about keeping dimensions on their places for your custom formulas to work – once defined, a hierarchy object unites multiple fields with their relative positions into a whole. You can drag and drop the entire hierarchy as a single dimension, and ContourCube will re-calculate the cube on the fly in a single step.
Hidden Dimensions
In ContourCube, you can set up a single report for a number of users by adding a dimension that is filtered according to the user for whom this report is intended. In ContourCube 4.0, you can also hide that dimension, still keeping it active and accessible from code. This extends your control over the interface, reducing your efforts to preserve relevance of figures and formulas in complex reports.
New Export Features
ContourCube 4.0 would not be complete without business IT infrastructure integration capabilities. Export to PDF and native Microsoft open document format – Word and Excel – complements ContourCube for use in information systems of any size and complexity. CSV text export with custom field delimiter makes for easy embedding and automation, and reduces deployment cost of your applications based on this component.
Remastered Look and Feel
The software advances in all aspects, and in the appearance as well. In this new version, ContourCube acquired new default grid view, easy to the eyes and comfortable for the use. It will make the analysis not only fast and easy, but also nice and more friendly to you.
Automatic Color Gradient on Dimensions
With this new feature, you will always know at which detail level you see your data at every moment. No more need to find the label of a row or column in dimensions area, it will be automatically highlighted for you with color gradient: the deeper you go into detail, the lighter is the color of dimensions. And of course you can customize this gradient from code, making your report different from another one.
Other Improvements
Support for UTF-8 encoding in exported documents, customizing appearance of filtered dimensions, runtime printer selection, enhanced property editors and a lot of minor interface and performance improvements – all this is ready for your applications based on ContourCube 4.0.