Prometheus Alerting and Monitoring
.MP4, AVC, 1280x720, 30 fps | English, AAC, 2 Ch | 3h 13m | 2.93 GB
Instructor: Sean Bradley
.MP4, AVC, 1280x720, 30 fps | English, AAC, 2 Ch | 3h 13m | 2.93 GB
Instructor: Sean Bradley
Learn and Build Your First Prometheus Alerting and Monitoring System for Your Infrastructure Today
What you'll learn
Install Prometheus and we see it working
Build a bare bones Prometheus server from scratch, in the cloud.
Learn how to set it up as a service so that it is always running in the background
Configure it to be behind a Nginx Reverse Proxy
Configure a domain name and add SSL to ensure transport layer encryption for the user interface
Add Basic Authentication to restrict user access
Install several Node-Exporters, local and external, manage there firewall rules and compare the differences
Learn the basics of querying metrics from simple metrics, instant vectors, range vectors, functions, aggregates and sub queries
Create custom metrics from complicated queries and save them as Recording Rules
Create Alerting Rules and demonstrate Inactive, Pending and Firing states
Setup a SMTP server to send email alerts
Configure Alert Manager to Send Alerts from Prometheus
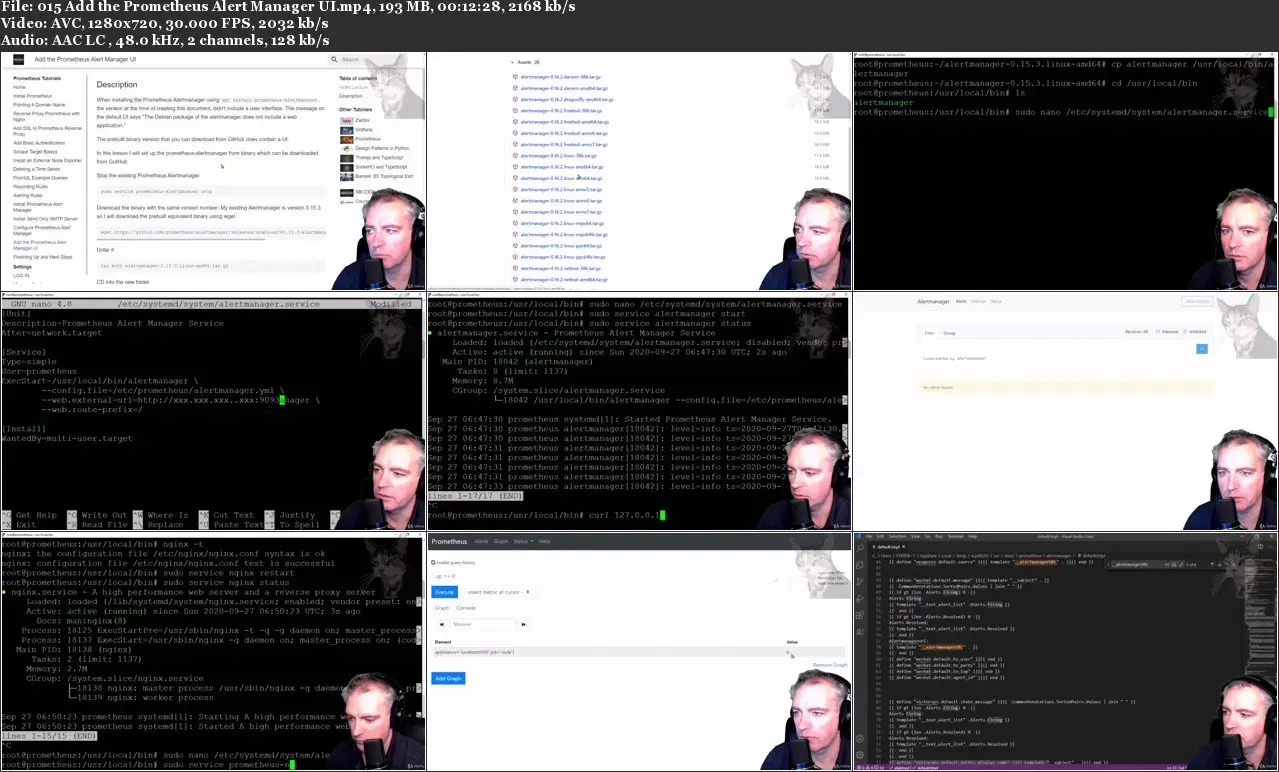
Add the Prometheus Alert Manager UI
Install Grafana
Setup the Prometheus Datasource inside Grafana
Setup Prometheus Dashboards for the main Prometheus service and Node exporters
Requirements
Basic Linux Experience
All commands entered during the lectures are provided in the corresponding resources
You have the choice of using dedicated hardware, cloud or locally hosted VMs. In this course, I predominantly use an unrestricted fresh install of Ubuntu 18 in the cloud.
Description
We learn the basics of Prometheus so that you can get started as soon as possible, and to follow the exercises, try them out for yourself and you can see it working.
In this course we will quickly build a bare bones Prometheus server from scratch, in the cloud and on your own Ubuntu 20.04 LTS.
We will keep it simple and set it up on a default, unrestricted, un-customised Ubuntu 20.04 LTS. You will then be able to match what you see in the videos and copy/paste directly from my documentation and see the same result. Once you have the basic experience of seeing Prometheus work, you will be able to problem solve in a more directed manner, and apply your knowledge to other operating systems in the future.
At the end of the course, you will have a basic Prometheus setup, which will be in the cloud, behind a reverse proxy, with SSL, a domain name, Basic Authentication, with several custom recording rules, several alerting rules, several node exporters local and external, with alert manager using a send only SMTP server, a Grafana install, and configured with the Prometheus Datasource and several dashboards.
Who this course is for:
Network and Systems Administrators
Infrastructure Monitoring Specialists
IT Platform Specialists
DevOps Technicians
Enthusiasts wanting a better understanding and better visibility of their IT infrastructure in the home or office
Someone who is curious and wants a better understanding of what Prometheus is and what Prometheus is good at


