

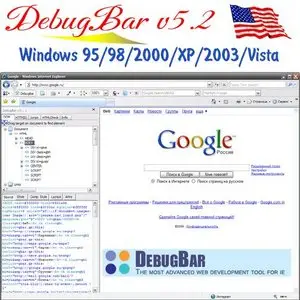
DebugBar v5.2

DebugBar v5.2 | win | 1 Mb
The DebugBar is an Internet Explorer toolbar that will help you improve and increase the web development productivity. DebugBar brings new services to surfers and professionals.
Here are some key features of "DebugBar":
· Send in one click a screenshot of the current Web Page by email.
· Zoom on the current web page.
· Search directly with your prefered web search engine
· Find a word in a web Page with the "Highlight in page" function
· Get the color code of any pixel in the web page and anywhere on the screen.
· Get script errors notification and send a screenshot with useful debugging information for developers in one click.
· Directly view the DOM tree of the loaded document with syntaxing colored HTML/JScript/VBScript/CSS code .
· Retrieve an HTML tag directly on the page by using the "Target"
· Access tag attributes, modify them and view the result direcly in Internet Explorer without reloading the document
· View external Javascript and CSS files attached to the document.
· View Internet Explorer HTTP and HTTPS requests and Web Server responses
· View defined cookies in the current loaded page
· View all the Javascript functions defined in the page and their source code
· Run Javascript code by using the interactive Javascript console
· Get useful informations (download time, number of images, images size) on the downloaded page.
Requirements:
· Internet Explorer 5.0 or above