

FlowJo 10.8.1

FlowJo 10.8.1 | 156 MB
The leading platform for superior analysis. FlowJo is a software package for analyzing flow cytometry data. Files produced by modern flow cytometers are written in the Flow Cytometry Standard format with an .fcs file extension. FlowJo will import and analyze cytometry data regardless of which flow cytometer is used to collect the data.
In FlowJo, samples are organized in a "Workspace" window, which presents a hierarchical view of all the samples and their analyses (gates and statistics). Viewing an entire experiment in a Workspace permits organizing and managing complex cytometry experiments and produces detailed graphical reports. FlowJo's ability to automate repetitive operations facilitates the production of statistics tables and graphical reports when the experiment involves many samples, parameters and/or operations.
Within a workspace, samples can be grouped or sorted by various attributes such as the panel of antibodies with which they are stained, tissue type, or patient from whom they came. When an operation on a group is initiated, FlowJo can perform the same operation on every sample belonging to that group. Thus, you can apply a gate to a sample, copy it to the group, and that gate will be automatically placed on all samples in the group.
FlowJo provides tools for the creation of histogram and other plot overlays, cell cycle analysis. calcium flux analysis, proliferation analysis, quantification, cluster identification and backgating display.
FlowJo’s strength is in analyzing whole experiments encompassing many related samples. In addition to gating and statistics, FlowJo has specialized analysis platforms for assays involving DNA/Cell Cycle, Kinetics, and Proliferation, among others. FlowJo’s sophisticated tools allow for generation of statistics, graphs, tables, web pages, and even movies. FlowJo integrates remote data hosting services (LIMS) and supports “cloud” deployment for excellent scaling of performance in a demanding, high-throughput environment.
Analyzing with FlowJo
You will find that your mode of operating FlowJo will probably be very similar to the following series of steps:
1. Load the samples into a workspace.
2. Create Groups for related samples, gates, etc.
3. Analyze a single sample in detail, creating gates, statistics, etc.
4. Apply the appropriate analyses to all the samples in a group.
5. Check gates on the samples in the group: modifications to accommodate sample to sample variation are easily made.
6. Generate a graphical layout in which you can display particular graphs from all samples.
7. Generate a table in which you can create particular statistics from all samples.
If you do similar experiments with different patients, you can then save a workspace as a template containing all the gates, statistics, tables, and layouts. Next week, when you do the same experiment with different patients, most of the work is already done for you! You simply have to import the new samples into the template workspace. Good template design saves a huge amount of software analysis time and standardizes reporting.
Backgating Analysis
Once your analysis contains subpopulations produced by gating within gates, it can be useful to see the source of a given subpopulation rendered graphically. Backgating analysis shows graphs of each gating operation with the final subpopulation highlighted in the graph of each stage.
Batch Operations
Batch operations (repetitive analyses performed on multiple samples) can be used in creating layouts and tables in FlowJo. In general, batch operations are performed on all samples in the current group (therefore, you will want to create sample groups that will serve to help you generate batch outputs). In this way, FlowJo is a program that doesn’t just analyze individual data samples. Rather, the focus is on analyzing groups of samples, experiments, or even multiple experiments at once.
Cell Cycle Analysis
FlowJo has a Cell Cycle Platform that uses multiple models to fit the data, constrains the fitting parameters, and automatically calculates the percentage of cells in the G1, S, or G2 phases. All models can be copied to other populations or samples, with the same easy drag and drop interface used to propagate other gates or analyses.
Compensation
Spectral overlap of stains is dealt with in the compensation tool in FlowJo. The interface for computing the compensation matrix is based on a collection of singly-stained control samples. You can then apply this compensation matrix to multi–stained samples. FlowJo adds compensated parameters to the multi-stained samples so you can view and analyze compensated data.
Derived Parameters
FlowJo lets you define new parameters for samples. These may include scaling parameters (to expand a region of interest), a Time parameter (for performing kinetics analyses), a Ratio parameter, or a parameter to convert between log and linear scaling. Derived parameter definitions can be copied to entire groups of samples.
Experiments, Workspaces , and Groups
An experiment can be either a single collection of samples, or stretch across multiple collections over a period of months. Whatever the scale of your research or time frame, the software is flexible enough to meet your experimental needs. The workspace shows a hierarchy of sample populations (Gates) and statistics that are created in the analysis. You can save, close, and reopen the workspace at any point and start where you left off. You may have multiple workspaces open at the same time and drag-drop samples and gates between workspaces. The workspace includes gates applied, statistics calculated, and tables and graphical layouts that you have designed. If you save your workspace, you will save all aspects. Within a workspace, samples may be added to groups based on chosen attributes. For instance, you can make a group of samples with similar stains or group samples by patient. Groups are a powerful feature of FlowJo and when you perform an operation on a group, it performs the operation on every sample belonging to that group.
FCS Scan
The FCS Scan tool will scan local or remote file systems for FCS files. This utility is handy when you want to find FCS files that match a specific criteria (stain protocol, operator ID, run date, machine, etc.), or when FCS files have been moved and need to be relocated.
The Gating Hierarchy
Another foundational concept in FlowJo is that of the gating hierarchy. When you first generate a gate on a sample (i.e. a lymphocyte gate), FlowJo shows you this gate (subset population) in the paradigm of a genealogical tree. In other words, the Lymphocyte subset is a child of the parent sample. It is shown in the workspace underneath the sample, indented a single level from the sample. If you were to make another gate on the sample (i.e., monocytes) FlowJo will create another new subset as another child of the sample; now, the lymphocyte and monocyte gates are siblings. Any operation that you can perform on a sample can also be performed on a subset of the sample. Therefore, you can view the lymphocyte subset and create gates (subsets) of this population. If you create a T cell gate within lymphocytes, then the T cell subset becomes a child of the lymphocytes (and by extension, a grandchild of the sample).
Kinetics (Ca++ flux) analyses
FlowJo provides a sophisticated platform designed to analyze kinetics data. FlowJo looks for a parameter that corresponds to time (and is named “Time”); if it does not, FlowJo allows you to create a time parameter (assuming a constant event rate). From the Kinetics platform, you can compute the maximal response time, the slope of a response, the fraction of responding cells, etc.
Movies
An analysis platform unique to FlowJo: view your data dynamically. Use the graph window or layout editor movies to generate graphs as a function of time (kinetic analyses), or to generate a graph of one ortwo parameters as a function of a third. This unique visualization lets you uncover subtle relationships in your data that would be impossible to see otherwise.
Plate Editor
An entirely new platform for annotating, grouping, and organizing plate-based flow cytometry data which has tools for plate metadata annotation, importing a CSV file for rapid plate annotation, and the ability to set up annotation for titrations.
Populations Comparison
The Population Comparison platform is a tool used to assess statistical differences in populations between files.
Proliferation Analysis
The Proliferation Platform is used to model proliferation data obtained using cell tracking dyes such as CFSE. FlowJo presents a graphical display as well as information about each generation in the subset. The proliferation platform also provides information about the fraction of cells from the original population that have divided, and the number of times these cells have divided. In addition the platform draws gates that separate each generation.
Statistics and Formulas
A host of standard statistical calculations can be performed on a subpopulation, then generalized to the whole experiment by batching. FlowJo will build a table of statistical analyses across groups of samples that you designate. These tables update continuously as long as you are modifying your experiment. For example, changes to gates will cause any statistic associated with the gate to update. You can export tables to spreadsheets or databases. You can also devise and apply your own formulas within FlowJo and use its tools to complete your analysis across multiple populations without tedious duplication of effort. The tables you create can be dragged and dropped from one workspace to another.
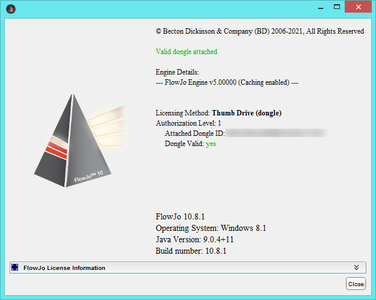
FlowJo 10.8.1
