NI LabVIEW 2018 Desktop Execution Trace Toolkit
NI LabVIEW 2018 Desktop Execution Trace Toolkit | 384.0 mb
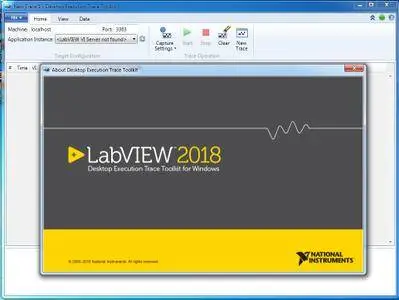
National Instruments (NI), has announced the release of LabVIEW 2018 Desktop Execution Trace Toolkit. This Toolkit helps you trace the execution of LabVIEW VIs on a Windows target during run time to detect and locate problems in code that could affect performance or cause unexpected behavior.
NI LabVIEW 2018 Desktop Execution Trace Toolkit
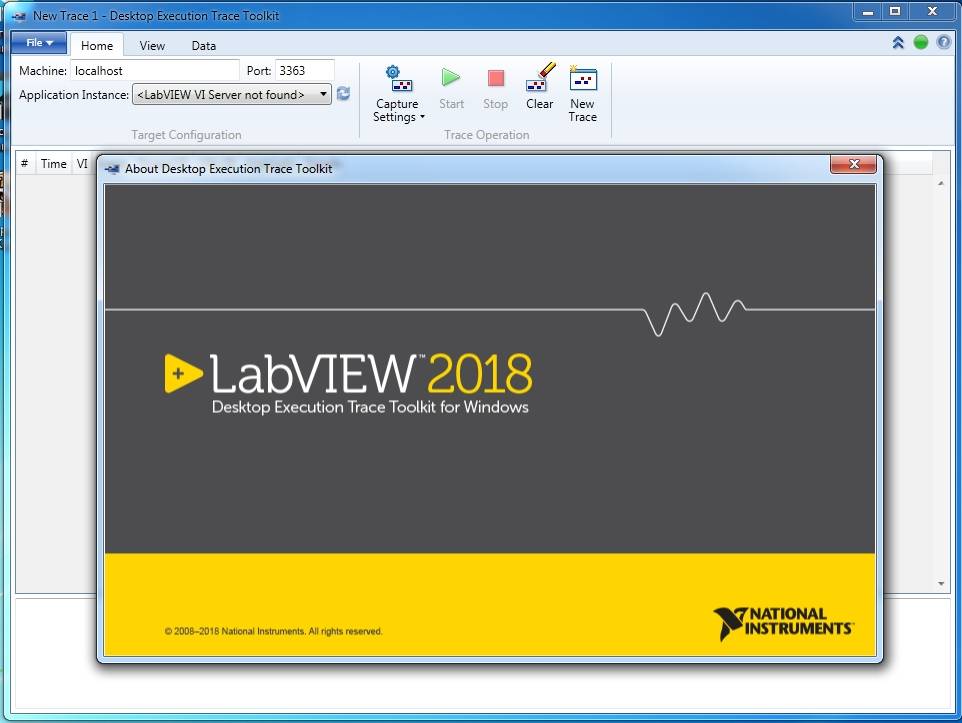
About LabVIEW Desktop Execution Trace Toolkit. The NI LabVIEW Desktop Execution Trace Toolkit helps you trace the execution of LabVIEW VIs on a Windows target during run time to detect and locate problems in code that could affect performance or cause unexpected behavior. It provides a chronological view of VI events, queue operations, reference leaks, memory allocation, unhandled errors, and subVI execution. With this toolkit, you can programmatically generate user-defined events from the block diagram of a LabVIEW application.
In addition, you can use this toolkit to parse the trace data with custom filters or export the data to a spreadsheet for documentation. By highlighting individual events, you can obtain additional information such as the call chain and CPU number. You also can double-click traced events to highlight the corresponding object on the block diagram.
Dynamic code analysis is an important practice for demonstrating correct behavior and debugging complex software. You can configure the LabVIEW Desktop Execution Trace Toolkit to monitor execution of VIs on a local machine or remotely over a network. In addition to VIs in the development environment, you can use the toolkit to profile debuggable executables and shared libraries.
About NI LabView. LabVIEW (Laboratory Virtual Instrument Engineering Workbench) is a graphical programming language that uses icons instead of lines of text to create applications. In contrast to text-based programming languages that use instructions to determine the order of program execution, LabVIEW uses dataflow programming. In data flow programming, the flow of data through the nodes on the block diagram determines the execution order of the VIs and functions. VIs, or virtual instruments, are LabVIEW programs that imitate physical instruments.
In LabVIEW, you build a user interface by using a set of tools and objects. The user interface is known as the front panel. After you build the front panel, you add code using graphical representations of functions to control the front panel objects. You add this graphical code, also known as G code or block diagram code, to the block diagram. The block diagram somewhat resembles a flowchart. The block diagram, front panel, and graphical representations of code compose a VI.
About National Instruments. Since 1976, National Instruments has equipped engineers and scientists with tools that accelerate productivity, innovation and discovery. NI’s graphical system design approach to engineering provides an integrated software and hardware platform that speeds the development of any system needing measurement and control. The company’s long-term vision and focus on improving society through its technology supports the success of its customers, employees, suppliers and shareholders.
Product: NI LabVIEW Desktop Execution Trace Toolkit
Version: 2018
Supported Architectures: 32bit / 64bit
Website Home Page : www.ni.com
Language: english
System Requirements: PC
Supported Operating Systems: Windows 7even SP1/ 8.1 Update 1 / 10 (version 1709) / Server 2012 R2 or Server 2008 R2 SP1
Software Prerequisites: LabVIEW Base, Full, or Professional Development System
Size: 384.0 mb
NI LabView 2018 version 18.0
Please visit my blog
Added by 3% of the overall size of the archive of information for the restoration
No mirrors please

![NI LabVIEW 2018 Desktop Execution Trace Toolkit]()
Please visit my blog
Added by 3% of the overall size of the archive of information for the restoration
No mirrors please
NI LabVIEW 2018 Desktop Execution Trace Toolkit