

Rainbow Analyst add-in Professional 12.6.1.1

Rainbow Analyst add-in Professional 12.6.1.1 | 2.3 Mb
Rainbow Analyst (so named for its uniquely powerful use of colour-coding) combines several areas of world-class spreadsheet auditing functionality.
- Excel™ spreadsheet audit and analysis tools with formula grouping and >50 analysis options.
- Spreadsheet comparison tools to track differences in cell formulas, macro code and other content.
- A unique set of spreadsheet clean-up tools which can even repair Excel’s underlying XML files.
- An audit sampling tool with three different methods of sample selection and a sample size calculator.
Summary Report
This is the place to start when you want an overview of a workbook you haven’t seen before.
It is always worth generating a Summary Report before looking at a spreadsheet in detail. It lists information about the Excel file (pink section), the workbook as a whole (green section), and each sheet in the workbook (blue section).
The report is quick to produce, and as well as giving an overall quality rating for the spreadsheet, it can indicate unexpected issues such as Visual Basic code, hidden sheets or hard-coding in formulas. Issues which have impacted the overall quality rating will be highlighted in yellow (somewhat significant) or red (very significant).
Password Tool
When you need to unprotect a worksheet and the password has been lost, this tool has the answer.
Most Excel users will have come across a situation where they needed to unprotect an old spreadsheet where the sheets and/or the workbook structure were protected with a password, and nobody could remember the correct password. Rainbow’s Password Tool can help in this situation, enabling you to remove protection by deleting sheet or workbook passwords.
Note that this tool will not unlock workbooks which require a password to open; these are encrypted and cannot be opened without knowing the password (or attempting to crack it with a “brute force attack”).
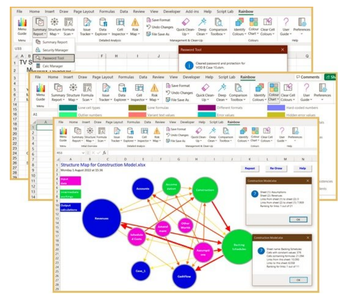
Structure Map
This neat diagram includes multiple levels of information and gives you an immediate sense of the overall structure of a workbook.
Although tabular reports (like the Summary Report) can display a large amount of information, it is not always easy to make sense of them. And so the Structure Map perfectly complements the Summary Report, giving you an immediately intelligible diagram of the structure of a workbook, showing all the sheets in the workbook as circles (nodes), linked by arrows (connectors) representing the logic flows between sheets.
The size of each circle in the diagram is an approximate indication of the size of (number of cells in) the sheet, and the circles are colour-coded to show whether a sheet contains mainly input data (purple), intermediate workings (green), or output calculations (blue). Similarly the arrows are colour-coded to indicate whether the flow of logic (number of links) between the sheets is small (yellow), medium (orange), or large (red). And you can simply click on any circle or any arrow to see detailed information such as the exact numbers of inter-sheet links.
Formula Scan
The Formula Scan function gives you a detailed report listing each unique formula, with a note of any potential issues that Rainbow has found.
And on the worksheet itself, each block of formulas is highlighted so that you can instantly spot inconsistencies.
The Formula Scan function analyses row and column differences to identify groups of copied formulas, and it then uses Rainbow’s unique set of colours to highlight each group. This lets you see at a glance where there are inconsistent formulas in a row or column (which may indicate an error), and it allows you to check just one cell in a group and know that all the other cells have the same formula.
In addition, Formula Scan can run a battery of tests on the first formula in each group, listing any detected problems in a report, and it can flag some or all formulas so that progress on auditing them and resolving issues can be tracked with the Issue Tracker function.
Initial Overview functions
The Summary Report, Password Tool, Structure Map, and Formula Scan functions (explained above) are all to be found in the Initial Overview group on the Rainbow menu. The Password Tool is on the drop-down under Summary Report.
Also on the drop-down under Summary Report is the Security Manager function, which can hide or unhide and protect or unprotect selected worksheets, and Calc Manager which lets you control the calculation and recalculation of ranges and worksheets as well as all open workbooks.
Under Structure Map, the Inter-Sheet Logic function generates a tabular matrix that shows you the flow of logic between sheets in your workbook, and Data Links helps you track down where your spreadsheet calculations are linked to individual cells in another workbook.
Under Formula Scan, Logic Map gives you a visual picture that helps you quickly grasp the flow of calculation from inputs through workings to final results, and Logic Colours provides a key to the colours used in the Logic Map and lets you search for them in the worksheet.
Sample Data
When you’re auditing data (e.g. accounting entries) in a spreadsheet, this function helps you select a sample and determine sample size.
The Sample Data function selects a sample of rows for auditing and copies them into a report. It has three modes of sample selection: random, periodic, and conditional. The conditional search mode lets you specify a wide range of search criteria such as weekend dates, times outside working hours, numeric values outside certain limits, or specific text values.
It also offers a sample size calculator, which can help you determine the sample needed for you to have a certain level of confidence in your results. This uses the well-known Cochran formula (with finite population correction), so that it delivers the same results as industry-standard online calculators.
Data Explorer
This function shows you where there are tables of data in your spreadsheet, and where the data comes from.
Excel now has many ways to represent blocks of data; as data tables, as query tables, as combined data/query tables, and as pivot tables. And underlying these visible blocks of data are two kinds of entities that are not normally visible: (1) connections, which are the “data pipes” that define how data flows from external applications, and (2) pivot caches, which are the “data stores” that hold the data for pivot tables.
The Data Explorer function helps you make sense of this complexity, by providing you with two linked and interactive reports listing all the tables, connections and pivot caches in your workbook. These interactive reports let you drill down to see further information about each item, some of which you can then easily edit.
Cell Inspector
With this interactive tool you can see what cells mean and trace their precedents and dependents.
The Cell Inspector (which you can invoke by pressing ALT+F10) is an interactive function which displays the precedents and dependents of the currently selected cell, and also provides a best-guess description of the meaning of each cell.
It will take you to each precedent or dependent (double-click the relevant line or click the appropriate button) so that you can click on the underlying spreadsheet and explore the logic and meaning of each cell. Then click the back-arrow button to return to where you were before. The Cell Inspector title bar shows how many steps you are from the original cell (#1) where you started. And you can click the Parse Formula button to see a structured layout which can help with understanding long formulas.
Risk Map
The Risk Map function highlights cells and formulas with potentially problematic characteristics.
The Risk Map function enables you to highlight cells and generate reports analysing any or all of 24 different potential risks such as hard-coded numbers or hidden contents. Each potential risk has its own colour, which you can see from the Analysis Wheel or the Colour Chart, and Rainbow uses these colours to highlight the corresponding cells in your spreadsheet, and also on each Risk Map report.
Under the option buttons on the Risk Map form is the Analyse macros box, where you can tell Rainbow to analyse any Visual Basic (macro) code in the selected workbook. It will detect and report on any macros which are set to run automatically when you open the workbook, as these can sometimes present a serious security risk. It will also report any macros which appear to have been generated with Excel’s “Record Macro” function.
Detailed Analysis functions
The Sample Data, Data Explorer, Cell Inspector, and Risk Map functions (explained above) are all to be found in the Detailed Analysis group on the Rainbow menu.
Under Sample Data, Comments Report generates a report on all flagged issues and/or all cell notes or threaded comments in the workbook. Delete Comments correspondingly lets you delete all flagged issues and/or all comments.
Under Data Explorer, Macro Explorer lets you easily see any macros in the workbook and get a sense of how they affect your workbook data, and Names Toolbox provides a range of tools to help you audit and control the use of defined names in the workbook logic.
Under Cell Inspector, Find Cells searches for specific formula, text or number values, dates, days, or times, with a wide range of search criteria, and Merged Cells Tool gives you a report on merged cells and various options for unmerging them.
Under Risk Map, Logic Analysis can report on up to 24 items related to cell types and dependency logic, and Analysis Wheel lets you select from Rainbow’s whole range of analysis options, run the analysis, and then review the highlighted cells in the current sheet.
Quick Clean-Up
This is the quick and easy way to get a workbook ready for analysis and auditing.
The Quick Clean-Up function provides a quick and simple way to prepare a workbook for detailed analysis using Rainbow’s other functions. It combines various operations from the Security Manager and Format Editor functions to unhide hidden sheets, unprotect protected sheets, and unhide hidden rows and columns.
Optionally this function can clear cell colours and patterns, and it also selects Normal view (rather than e.g. Page Break Preview) for all sheets.
Deep Clean
Deep Clean can fix problems that are beyond the scope of conventional tools (and even other Rainbow functions).
Nearly all Rainbow functions work on a spreadsheet as loaded into the computer’s memory. So if you make changes with Rainbow, but don’t then save the spreadsheet, the workbook file on disk remains unchanged. Deep Clean is different; it works by carefully editing the spreadsheet file as saved on disk (and then saving the changed file under a different name).
This means that Deep Clean can fix problems caused by deep-seated corruption. It can clean up corrupted styles (custom formats), “phantom links” and related issues. It was able to clean up the severely corrupted file shown here, reducing the file size from 2.9 MB to 0.8 MB.
Comparison Toolbox
This versatile comparison tool is useful for version control and many other applications.
The Comparison Toolbox function can work in several different ways, depending partly on what you select in the Comparison Toolbox dialog box, and partly on what range(s) you have selected before you click Comparison Toolbox. The most common uses are to compare one sheet in a workbook with any or all of the other sheets in the same workbook, or to compare corresponding sheets (i.e. sheets with the same name) in two different workbooks. This makes it very useful for workbook version control.
Going further, if you select the appropriate range(s) before clicking Comparison Toolbox, it can compare a particular multi-cell range (rather than the whole worksheet) with corresponding ranges in other sheets or another workbook. And if you first use the Ctrl key (with the mouse) to select multiple areas (e.g. tables) in a single worksheet, it can compare the first area in the worksheet with all the others. And if you have more than one workbook open, it can compare all the modules and macros (Visual Basic code) in two different workbooks.
Management & Clean-Up functions
The Quick Clean-Up, Deep Clean, and Comparison Toolbox functions (explained above) are all to be found in the Management & Clean-Up group on the Rainbow menu.
Also in the Management & Clean-Up group are the Save Format, Undo Changes, and File Save As functions, which help you manage changes made by Rainbow in a workbook.
Under Quick Clean-Up, Clean Up Formats removes superfluous formats (which can generate an Excel error message), Trim Unused Space removes blank space around the used area of a worksheet (which can cause bloating), and Tidy Up Reports converts Rainbow reports for sharing with colleagues who do not use Rainbow.
Under Deep Clean, Deep Compare finds differences in the structure of two workbooks which are not explained by changes in cell contents, and Temp Files opens a File Explorer window on the folder which contains the Rainbow Log file and also any unzipped files created by the Deep Clean function.
Under Comparison Toolbox, Sample Data selects a random or periodic sample of data from a worksheet and copies it to a report for further auditing. Scramble Workbook replaces the data and text in a workbook with meaningless values, so that you can send it to Rainbow support or to colleagues who may need to examine the workbook structure but not the data.
Home Page - https://www.themodelanswer.com/