Superluminal Performance 1.0.6470.3335 (x64) | 76.8 Mb
Profiling, Re-Invented. The new industry standard profiling tool. Do you use instrumentation or sampling? Why compromise? Superluminal brings you the best of both in one seamless experience.
Zero integration time
Hit the ground running. No need for intrusive markup of your code.
Graphical Interface
Best-in-class visualizations let you explore and recognize performance problems with minimal effort.
Unbiased Profiling
Annotating your code means bias towards where you think the problem is, instead we show you where it really is.
Provides Context
Get the big picture by going beyond the bare statistics. Understand why, when and in what order your code is executing.
Kernel Level Stacks
See what really happens under the hood when you perform that system call. It’s like having X-ray vision.
Precision
Unprecedented precision through our high frequency sampling engine (8KHz+). When needed, add even more precision through use of our API.
Superluminal is great. We mostly use it to profile long-running processes and thread interactions (think: servers, content conversion, offline rendering). Its UI is really simple and quickly allows you to go from overview, thread interactions, PC samples, to source and disassembly. We fixed many performance issues, including ones we didn’t even know we had.
Visual UI
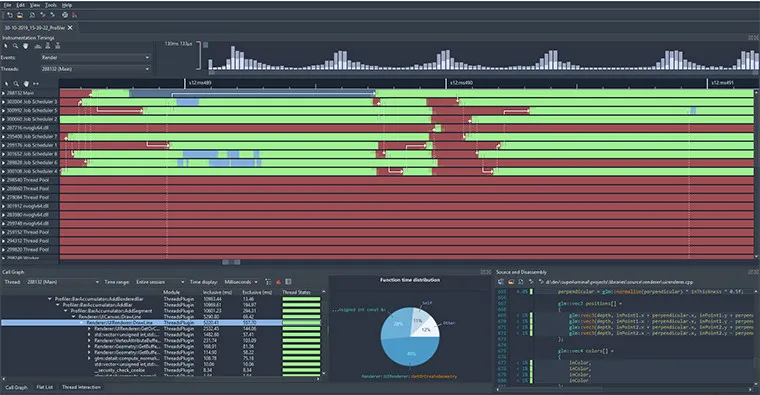
Superluminal is the only sampling profiler that displays the profiling data in a visual UI. Sampling data is displayed on a per-thread timeline, which allows you to see exactly what function is being called when, in what order, and what other functions are being called around it.
Multithreading Analysis
Understanding the complex interactions between threads in a program can be key in resolving performance issues. These complex interactions are visualized in an intuitive interactive interface that allows you to inspect blocking and unblocking callstacks and easily navigate between them.
High Frequency Sampling
High frequency sampling (8 – 40 kHz, depending on platform) allows you to hit the ground running without the need to make any code modifications. Sampling can start right from the start of the application, allowing you to inspect application startup, including DLL loading, the static initialization phase and more.
Source & Disassembly
The source window displays source code along with per line timing and thread state information. To drill down even deeper, a mixed-mode disassembly view lets you view per-instruction timing information. If no source code is available, the disassembly is displayed.
Filtering
Superluminal is capable of isolating a specific portion of a capture. Investigate unexpected frame spikes, or zoom in to the startup phase of your application.
Home Page - https://superluminal.eu/


