


SigmaPlot 11.0
SigmaPlot 11.0 | 51,6 MB
SigmaPlot software helps you quickly create exact graphs. SigmaPlot graphing software from SYSTAT takes you beyond simple spreadsheets to help you show off your work clearly and precisely. With SigmaPlot, you can produce high-quality graphs without spending hours in front of a computer. SigmaPlot offers seamless M'zoft Office integration, so you can easily access data from M'zoft Excel spreadsheets and present your results in M'zoft PowerPoint presentations.
Graphing software that makes data visualization easy
Graph creation starts with SigmaPlot's award-winning interface. Take advantage of industry-standard menu design, menu toolbars, right mouse button support and graph preferences. Select the graph type you want to create from the Graph Toolbar's easy-to-read icons. The interactive Graph Wizard leads you through every step of graph creation. You get compelling, publication-quality charts and graphs in no time. SigmaPlot offers more options for charting, modeling and graphing your technical data than any other graphics software package.
Compare and contrast trends in your data by creating multiple axes per graph, multiple graphs per page and multiple pages per worksheet. Accurately arrange multiple graphs on a page using built-in templates or your own page layouts with SigmaPlot's WYSIWYG page layout and zoom features.
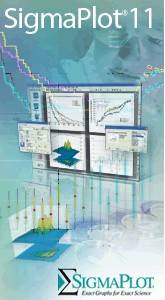
More than 80 2-D and 3-D technical graph types
From simple 2-D scatter plots to compelling contour plots, SigmaPlot gives you the exact technical graph type you need for your demanding research. And, to help you see interactions in your 3-D data, SigmaPlot powerfully renders multiple intersecting 3-D meshes with hidden line removal. With so many different chart and graph types to choose from, you can always find the best visual representation of your data.