


GRAFster 7.0.1.7
GRAFster 7.0.1.7 | 2.1 MB
Updated GRAFster7 is an easy to use charting and analysis application. Use it to quickly plot equities, indices, futures, mutual funds, currencies or any time series in a compatible data format. No need to be 'on line' all the time. Get your data with GimmeFreeData for free. It offers most of the usual technical analysis indicators without being redundant, a few uncommon ones, and some for which you would have to pay plenty if it were not for GRAFster7. Why pay more? For just the cost of a round trip trade, avoid the hype, clutter and complexity - get charts fast without exposing yourself to feature shock. After all, the fundamental technical analysis tool is the ruler.
Features:
Select from line, bar or candlestick style charts.
Create custom settings for each of the 30 editable indicators/studies.
Apply unique chart and indicator settings for each symbol/ticker.
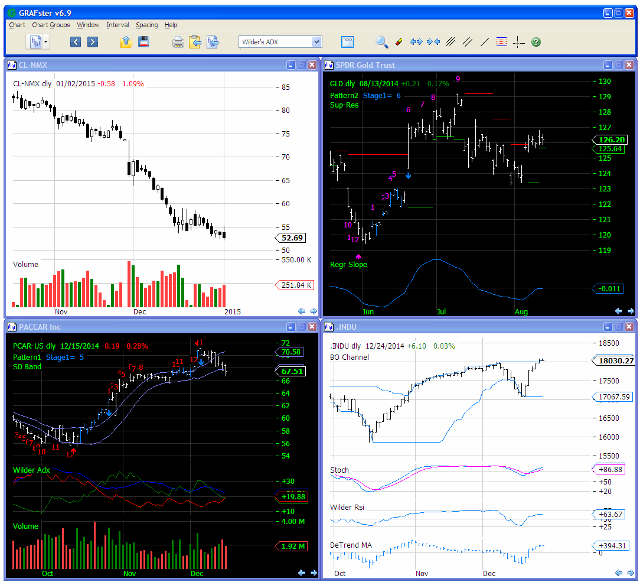
View multiple charts in any combination of symbol, indicator layout and time period.
Plot the relative strength (ratio) of one symbol/ticker to another.
Create custom chart layouts for instant retrieval as a Chart Group.
Use your Favorites List to quickly parse only the charts you want with one keystroke.
Scroll thru charts back and forth one or more bars at a time for instant replays.
Place 1, 2 or 3 non-overlay indicators below the price chart.
Copy and paste chart images, or save them in popular image formats.
Draw Trend Lines, Channels, Andrews Pitchforks and Fibonacci Retracements.
Predict turning points with two scarce price pattern techniques created by a respected analyst.
EoD Data Sources Supported:
ASCII csv text files in various arrangements.