

Bite-Sized Data Science with Python: Introduction
Bite-Sized Data Science with Python: Introduction
WEBRip | MP4/AVC, ~664 kb/s | 1280 x 720 | English: AAC, 58.5 kb/s (2 ch), 48.0 KHz | 418 MB
Genre: Development / Programming Languages | Language: English | +Project Files
WEBRip | MP4/AVC, ~664 kb/s | 1280 x 720 | English: AAC, 58.5 kb/s (2 ch), 48.0 KHz | 418 MB
Genre: Development / Programming Languages | Language: English | +Project Files
Follow along as we analyze a real-life dataset and learn data science with Python
Learn the basics of data science with Python, with this short course designed for students to follow along, and built around a concrete, real-world dataset.
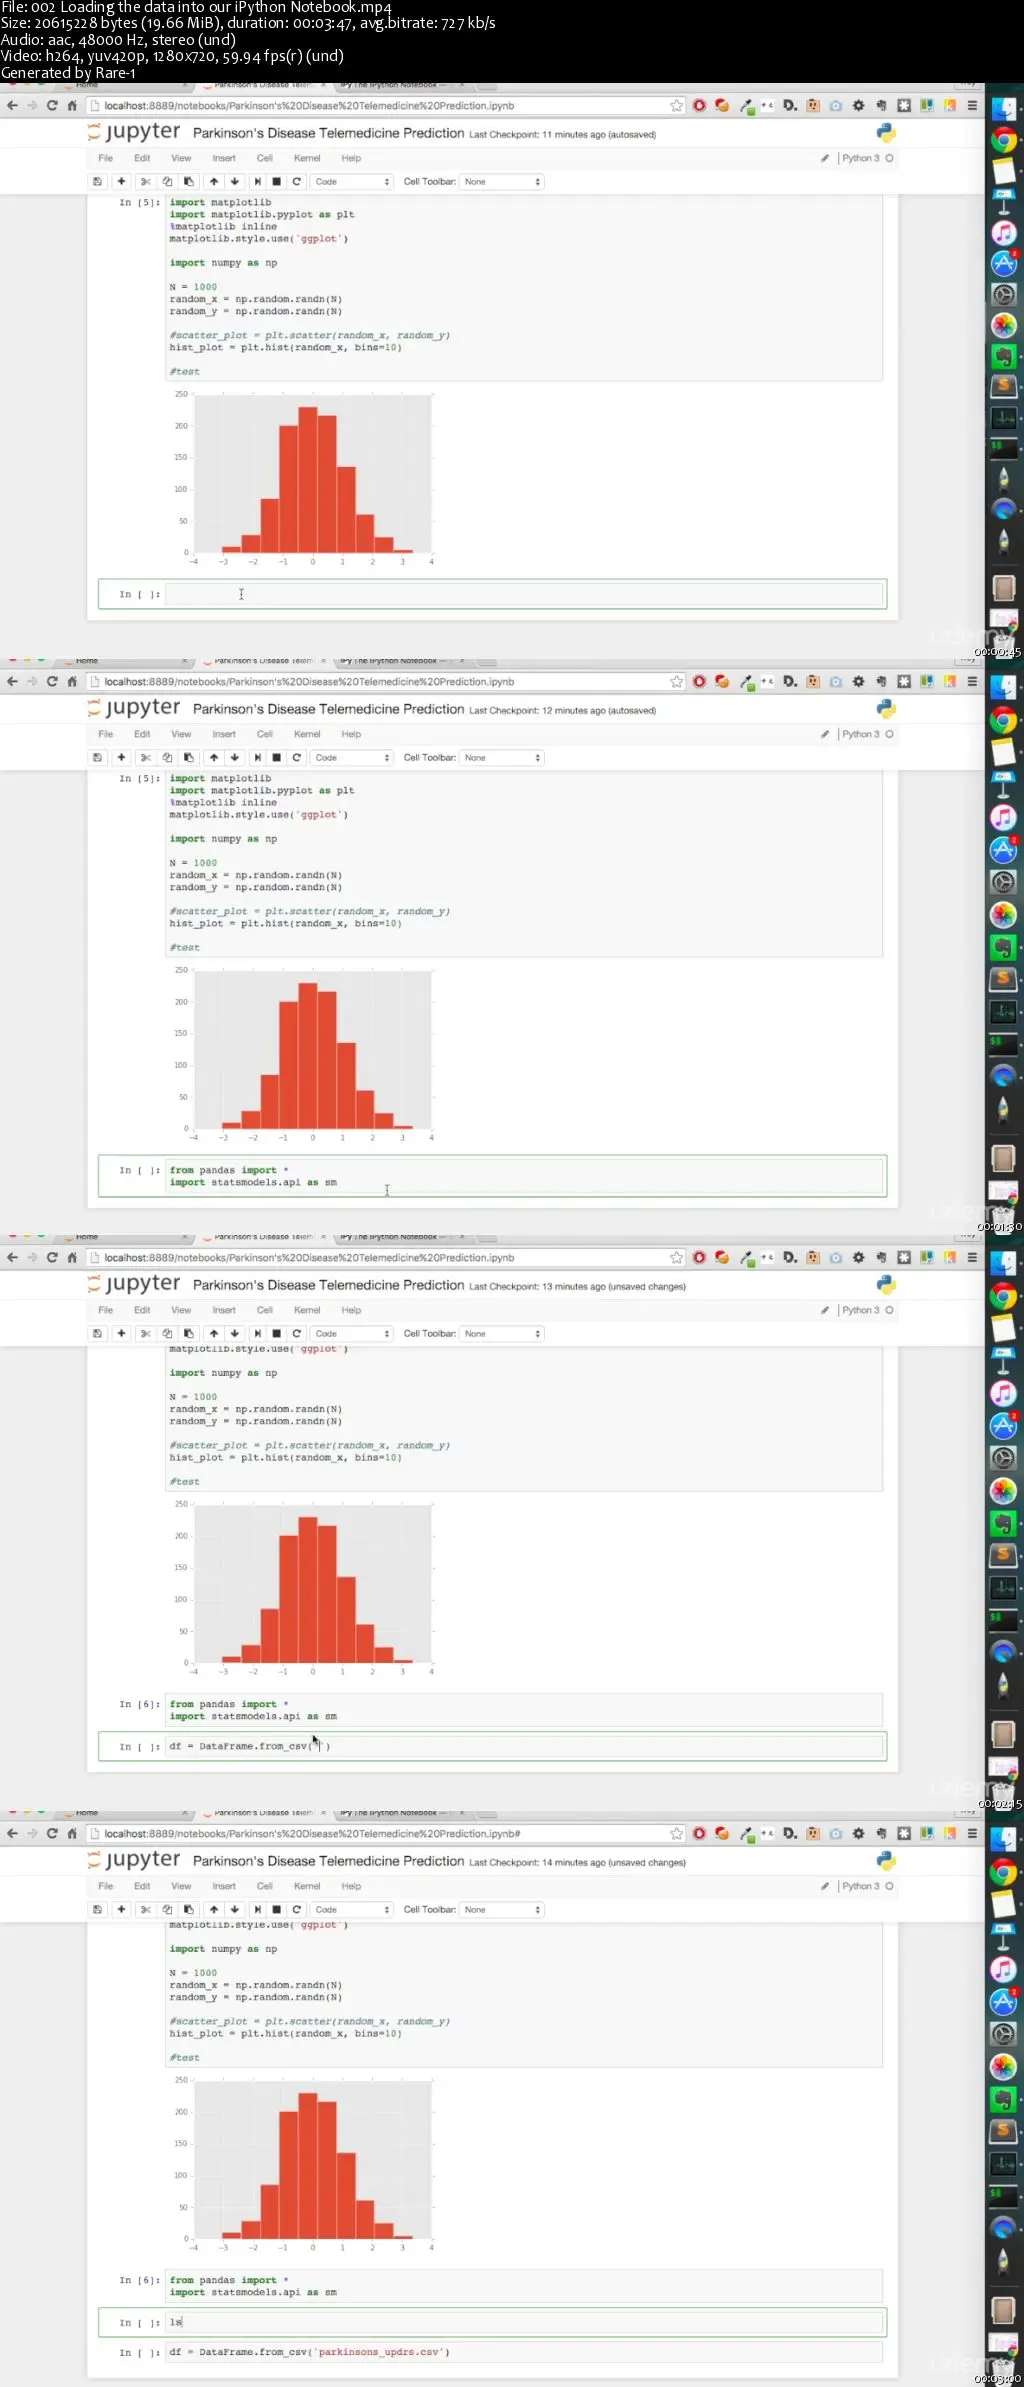
Listening to theoretical examples is never fun, and I've always liked actually applying what I learn to concrete examples, so this course is built around us analyzing a real-life dataset together. The dataset we'll be using is the "Parkinson's Disease Telemedicine dataset", and our goal will be to see if we can predict the severity of Parkinson's Disease in patients from just a dozen simple measurements, which would be a vast improvement over the current time consuming process that doctors and patients have to go through.
This course will provide a good introduction to several different aspects of data science, and all in Python, one of the most popular and powerful languages used by data scientists today.
You'll learn how to:
- Set up your data analysis research environment (in an iPython notebook)
- Visualize the data to understand it better
- Manipulate and transform data to prepare it for modeling
- Apply a statistical model to the data
The course is comprised of short lectures which walk you through the data analysis, as you follow along. There are also several coding exercises throughout to test your knowledge!
Check out the course to learn data science with Python today!
What are the requirements?
- Students should have experience writing, at a minimum, basic programs in Python
What am I going to get from this course?
- Over 24 lectures and 1 hour of content!
- Manipulate and transform data series and tables in Python
- Build a multiple regression model in Python
- Use iPython Notebook for research and analysis in Python
- Visualize data to glean insights from it, in Python
What is the target audience?
- This course is best suited for students who already have a basic understanding of both Python and statistics
- This course is for students who like learning with real-life, concrete examples, and following along by programming on their own computers
- This course is for students who want to learn the basics of data manipulation and visualization, and statistical model building in Python
Curriculum
Section 1: Welcome, information about this course
Lecture 1 Introduction 01:59
Section 2: Setting up Python and Libraries
Lecture 2 If you already have Python installed 02:15
Lecture 3 File and command to install all necessary libraries at once, with pip Text
Lecture 4 Links to help you install pip Text
Lecture 5 The libraries, explained 02:33
Lecture 6 If you want to install Python and the libraries at once 01:33
Section 3: Our data set: the Parkinson's Telemedicine Dataset
Lecture 7 Downloading the data 02:32
Lecture 8 A quick explanation of the dataset 02:12
Section 4: Starting our analysis
Lecture 9 Starting a new iPython Notebook 05:44
Lecture 10 Loading the data into our iPython Notebook 03:47
Section 5: Manipulating data with pandas, the data analysis library
Lecture 11 DataFrames are data tables 02:26
Lecture 12 Series are single rows or columns of data 04:17
Lecture 13 Slicing DataFrames to get the data we need 02:53
Lecture 14 Keeping track of the variable names we need 03:57
Lecture 15 Coding Exercise: summary statistics Text
Section 6: Visualizing the data to understand it better before modeling
Lecture 16 Looking at the data's distributions with box plots and histograms 06:26
Lecture 17 Seeing multicolinearity with a scatter plot matrix 03:22
Lecture 18 Coding exercise: a single correlation Text
Section 7: Transforming the data to prepare it for modeling
Lecture 19 Taking care of multicolinearity 01:55
Lecture 20 Log transforming data to take care of skewed distributions 07:31
Lecture 21 Coding exercise: practicing apply() Text
Section 8: Modeling the data
Lecture 22 Applying a multiple regression to answer the ultimate question 04:41
Section 9: Conclusion
Lecture 23 Thank you 01:32
Lecture 24 Download the data and iPython notebook that was used throughout this lecture Text
Bite-Sized Data Science with Python: Introduction
LabView - Collective Books
Mega E-books Pack (2013)
Malware Centric E-book Collection
Huge Electricity, Magnetism, A..., Healing - EBooks Collection
Premium IT eBooks Collection
Huge Encyclopedias - EBooks Collection
Osprey Publishing - Military History Books Collection
Gale Encyclopedias - Full Pack
IT Books Collection (Basic - Intermediate - Advance)
Medicinal and Aromatic Plants - 50 Volume Set
Doctor Who ebooks Collection
Learning HTML Ultimate Collection
Comprehensive Robotics Books Collection
Great Royal Web Design Pack
Civil Engineering Geotechnical books
Luftwaffe Colours Collection
Many Thanks to Original uploader.
For More Rare Movies Check out my blog!
Download Links:
No Mirrors Please