

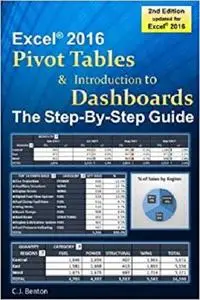
Excel Pivot Tables & Introduction To Dashboards The Step-By-Step Guide
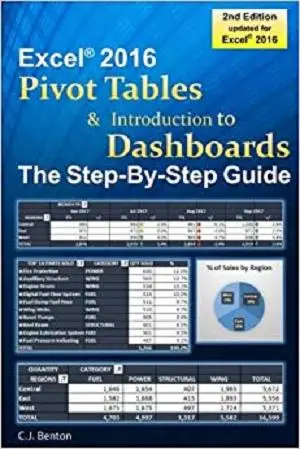
Excel Pivot Tables & Introduction To Dashboards The Step-By-Step Guide by C.J. Benton
English | January 4, 2017 | ISBN: 1541343212 | 146 pages | PDF | 27 Mb
English | January 4, 2017 | ISBN: 1541343212 | 146 pages | PDF | 27 Mb
Learn how to create Pivot Tables quickly and easily with this step-by-step guide!
Updated for Microsoft® Excel® 2016! This book provides easy to follow step-by-step examples with screenshots demonstrating how to create Pivot Tables and basic Dashboards. In just a few short hours, you’ll learn how to:
In addition to the above, you will also learn how to create, format, and update a basic Dashboard using Pivot Table data. Including how to incorporate charts and performance symbols into your reporting.
A great resource for:
Imagine the time you'll save by not having to search the internet or help files to learn the most practical ways of using one of Microsoft® Excel’s® best features!
Feel Free to contact me for book requests, informations or feedbacks.
Without You And Your Support We Can’t Continue
Thanks For Buying Premium From My Links For Support
Without You And Your Support We Can’t Continue
Thanks For Buying Premium From My Links For Support