Grafana Lgtm Stack For Monitoring, Metrics, Logs, And Traces
Published 11/2024
MP4 | Video: h264, 1280x720 | Audio: AAC, 44.1 KHz
Language: English (India) | Size: 2.49 GB | Duration: 9h 3m
Published 11/2024
MP4 | Video: h264, 1280x720 | Audio: AAC, 44.1 KHz
Language: English (India) | Size: 2.49 GB | Duration: 9h 3m
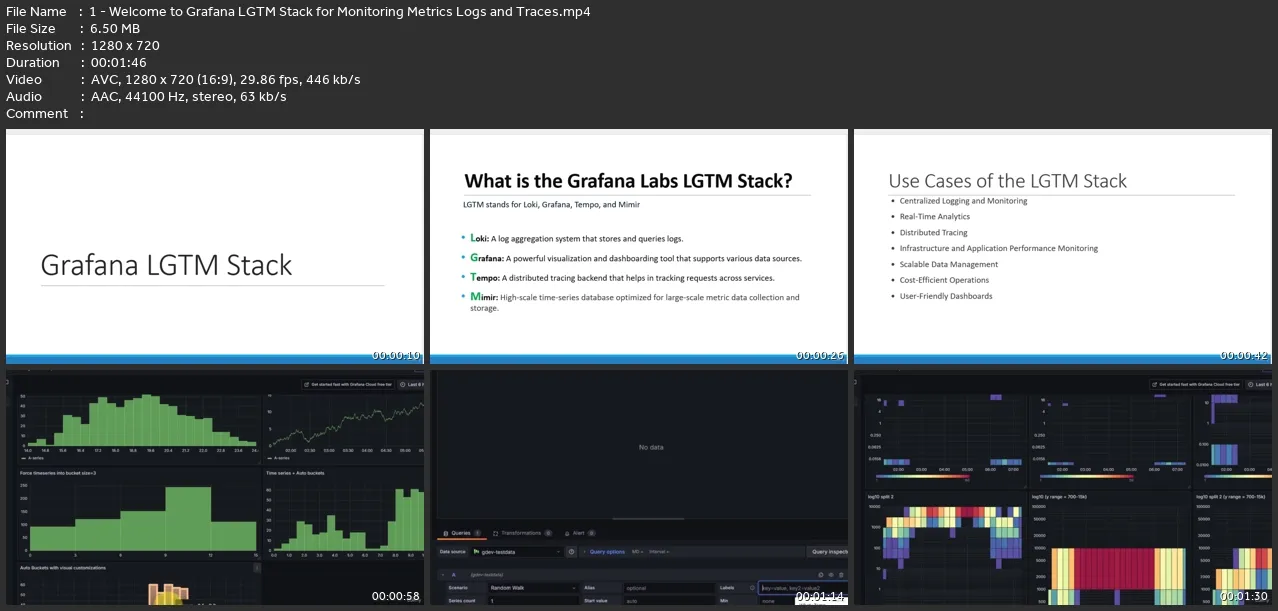
Grafana Labs’ observability: Loki - logs, Grafana - dashboards and visualization, Tempo - traces, Mimir - metrics
What you'll learn
Understand the architecture and components of the Grafana LGTM stack for effective monitoring and observability.
Build and customize Grafana dashboards to visualize metrics, logs, and traces with precision.
Configure and integrate Prometheus, Loki, and Tempo data sources for seamless data ingestion and analysis.
Master advanced panel and visualization options to create interactive and insightful dashboards.
Apply transformations and queries to refine, group, and analyze data efficiently within Grafana.
Leverage Loki for log aggregation and Tempo for distributed tracing to troubleshoot system performance.
Explore Mimir for long-term storage of Prometheus metrics and optimize storage and retrieval.
Gain hands-on experience with real-world scenarios, from setting up data sources to implementing observability solutions.
Requirements
Basic Understanding of Monitoring and Observability Concepts – Familiarity with metrics, logs, and traces is helpful but not mandatory.
Optional Knowledge of Grafana or Similar Tools – Prior experience with monitoring tools is beneficial but not required; beginners are welcome.
Create an Account with Grafana Cloud – Learners should sign up for a free Grafana Cloud account to explore the stack features and functionalities.
Access to KillerCoda – Use KillerCoda for hands-on Grafana LGTM stack simulations and guided scenarios.
Access to Grafana Playground – Familiarity with the Grafana Playground is encouraged for experimenting with dashboards and visualizations.
Basic Understanding of Monitoring Concepts – While not mandatory, a foundational knowledge of metrics, logs, and traces will enhance learning.
Description
Unlock the full potential of the Grafana LGTM Stack—Loki, Grafana, Tempo, and Mimir—and master the art of monitoring, visualizing, and troubleshooting complex systems. This course is designed to equip you with in-demand skills in observability, helping you monitor metrics, aggregate logs, and trace distributed systems efficiently.What You’ll LearnBuild, customize, and optimize Grafana dashboards for effective data visualization.Configure and integrate Loki for log aggregation and Tempo for distributed tracing.Leverage Mimir for long-term metric storage and advanced analytics.Master Grafana panel options, transformations, and query expressions.Troubleshoot systems by analyzing metrics, logs, and traces in real-world scenarios.Course HighlightsExplore hands-on examples and practical scenarios to implement observability in modern infrastructures. Learn how Prometheus, InfluxDB, Loki, and Tempo work seamlessly within Grafana to help you monitor, analyze, and optimize performance. Dive into advanced visualization options like Heatmaps, Pie Charts, Node Graphs, and more, while gaining insights into powerful transformations and data filtering.This course includes over 125 in-depth lectures across key topics like visualization, data sources, transformations, and Grafana setup. Whether you’re a beginner or an experienced professional, you’ll gain actionable knowledge and practical expertise to implement the Grafana LGTM Stack in real-world projects.By the end of this course, you’ll be confident in monitoring systems, creating stunning dashboards, aggregating logs, and tracing distributed systems, enabling you to enhance system performance and reliability effectively.Enroll now to take your observability skills to the next level!
Who this course is for:
IT Professionals and System Administrators – Ideal for those managing system performance, troubleshooting, and implementing observability in IT infrastructure.,DevOps Engineers and SREs – Perfect for individuals focusing on continuous monitoring, log aggregation, and distributed tracing in production environments.,Data Analysts and Developers – Valuable for those analyzing system data, visualizing metrics, or integrating observability tools into applications.,Students and Beginners in Monitoring – Designed for learners with little to no experience who want to understand and apply the Grafana LGTM stack from scratch.,Business and Operations Teams – Useful for stakeholders seeking insights into system health and performance metrics to support operational decisions.,Hobbyists and Enthusiasts in Observability – Great for individuals exploring monitoring solutions and learning to leverage open-source tools like Grafana.


