

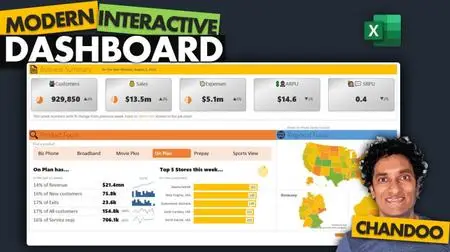
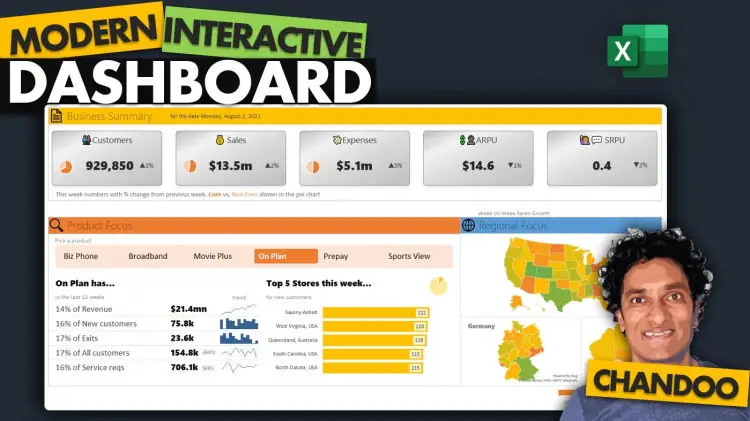
Make AWESOME Dashboards with Excel
Make AWESOME Dashboards with Excel
Duration: 1h 8m | .MP4 1280x720, 30 fps(r) | AAC, 44100 Hz, 2ch | 529 MB
Genre: eLearning | Language: English
Duration: 1h 8m | .MP4 1280x720, 30 fps(r) | AAC, 44100 Hz, 2ch | 529 MB
Genre: eLearning | Language: English
Dashboards skills are highly valued in business analytics. In this concise yet comprehensive tutorial, I will teach you how to create modern, interactive & dynamic business dashboard for executive / top management scenarios.
You will learn:
How to design the dashboard from business requirements
Setting up dashboard workbook in Excel
Connecting multiple data tables using "Table relationships"
Analyzing data quickly & effectively with "Pivot tables"
Preparing visual story using Excel's "graphs & sparklines"
Making your dashboard interactive with "Slicers"
Using "Map Charts" to present geographical detail
Best practice when it comes to "Formatting" your outputs
Who is this class for?
This class is perfect for business & reporting professionals. You need intermediate or above level of Excel skills to enjoy the session.