Power Bi Master Class - Dashboards And Power Bi Service

Power Bi Master Class - Dashboards And Power Bi Service
Last updated 9/2024
MP4 | Video: h264, 1280x720 | Audio: AAC, 44.1 KHz
Language: English (US) | Size: 2.06 GB | Duration: 5h 34m
Last updated 9/2024
MP4 | Video: h264, 1280x720 | Audio: AAC, 44.1 KHz
Language: English (US) | Size: 2.06 GB | Duration: 5h 34m
Learn how to quickly and effectively create data analysis and interactive dashboards and publish to the Power BI Service
What you'll learn
Enjoy CLEAR and CONCISE step by step lessons from a best selling Udemy instructor in FULL HD 1080 P video
Learn to use the EASIEST Business Intelligence tool to create INTERACTIVE Reports and Dashboards in Power BI
Lifetime access to course materials and practice activities. 100% money back guarantee
Load Dashboards and Reports into the Power BI Service and Configure the Power BI Service
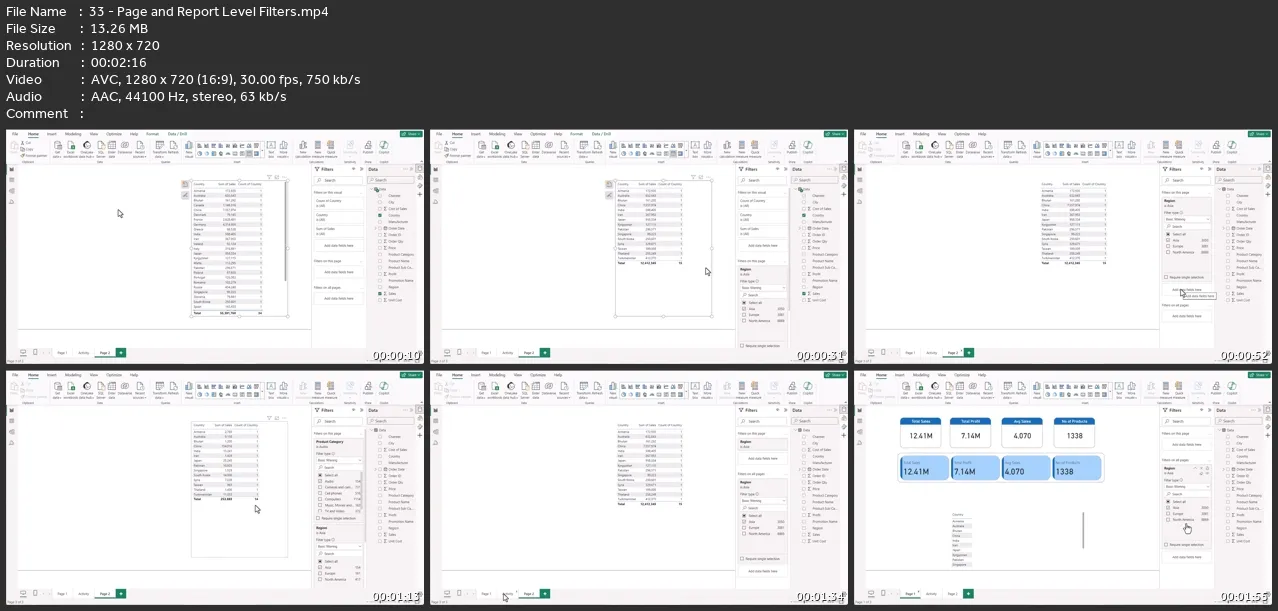
Learn to use FILTERS and SLICERS to ask the MEANINGFUL questions of your data
Learn how to use different graph VISUALIZATIONS such as column, line, pie, combo, treemap, geographical and waterfall
Learn to create POWERFUL tables and matrixes of reporting data
Work with Power BI and Excel together - Learn to use Excel to analyze Power BI data
Learn to use CUSTOM Visualizations and Themes in Power BI
Requirements
You will require Power BI desktop and access to the Power BI Service on the Internet
You should be able to work with data in Excel and do basic reporting
You will require a work email address to sign up for the Power BI Service
Download the Power BI Desktop app which is available free from Microsoft for Windows
Description
Skills in data analysis, reporting and the creation of dashboards are highly valued in today's business environment. Microsoft Power BI is now recognized as the leading Business Intelligence tool in the world for the development of reports, data analysis and dashboards.In this course you will learn the to use the amazing Power BI tool to create dashboards and how to use the power BI service to publish your work. COURSE CONTENT AND OUTCOMESIntroduction and Course ContentSigning up for Power BI and Loading DataTables , Cards, Matrix and Multi Row CardsColumns, Bar, Line, Pie, Treemap, Geographical and Scatterplot graphsFilters, Slicers and Asking questions of your dataPerforming trend analysis Creating Interactive Reports and DashboardsPublishing to Power BI Service and Configuring Power BI ServiceSecurity and creating WorkspacesData Gateways and refreshing data setsUsing Drill throughs, bookmarks, advanced tool tips and groupingUsing Custom visualizations and themesPower BI and analyzing data with Microsoft ExcelPublishing and embedding dashboards and reportsABOUT THE TRAINERI am a Udemy Instructor Partner with more than 20 years' experience in training & management consulting. I specialise in training business users to learn powerful methods and techniques to transform data into useful information and intelligence as well as learning strong data analysis methodology using Microsoft Excel, Microsoft Power BI, Looker Studio (formerly Google Data Studio), Amazon QuickSight and ChatGPT.WHAT STUDENTS ARE SAYINGThanks for the course, I can now make reports come aliveThe course really does go through everything you will need to know to start using Power BI. It will definitely help me to create some really good visuals which can be used to show visually how my team is progressing and completing the daily work. Would highly recommend this course for anyone who needs to analyse data.Ian explained each and every detail. Gave me good insights and information required to start working on PowerBI.DATA ANALYSIS COURSES ROADMAPThe tech industry is constantly evolving, there have been significant investments in the field of AI, machine learning and big data and this means there is a growing demand for data analysts. With the right skills and a proactive approach, a data analyst can reach unprecedented heights! I currently offer the following 14 courses on Udemy covering a wide variety of tools and skills that will empower you to confidently explore the dynamic realm of data analysis, gain valuable skills in data interpretation and drive intelligent, data driven decisions.Microsoft ExcelIntroduction to Analyzing Data with Excel Pivot TablesComplete Introduction to Excel Power PivotComplete Introduction to Excel Power QueryExcel Interactive Dashboards and Data AnalysisComplete Introduction to Business Data AnalysisTables and Formulas with ExcelMicrosoft Power BIComplete Introduction to Microsoft Power BIComplete Introduction to Power BI Query EditorPower BI Master Class-Data Models and DAX FormulasPower BI Master Class - Dashboards and Power BI ServiceGoogleComplete Introduction to Google Sheets Pivot TablesComplete Introduction to Looker Studio (formerly Google Data Studio)Amazon QuickSightComplete Introduction to Amazon QuickSightChatGPTIntroduction to Analyzing Data with ChatGPT
Who this course is for:
Excel users who want to learn how to create professional reports in Power BI
Power Bi Master Class - Dashboards And Power Bi Service