Data Analysis, Data Science & Visualization: Python & Pandas
Data Analysis, Data Science & Visualization: Python & Pandas
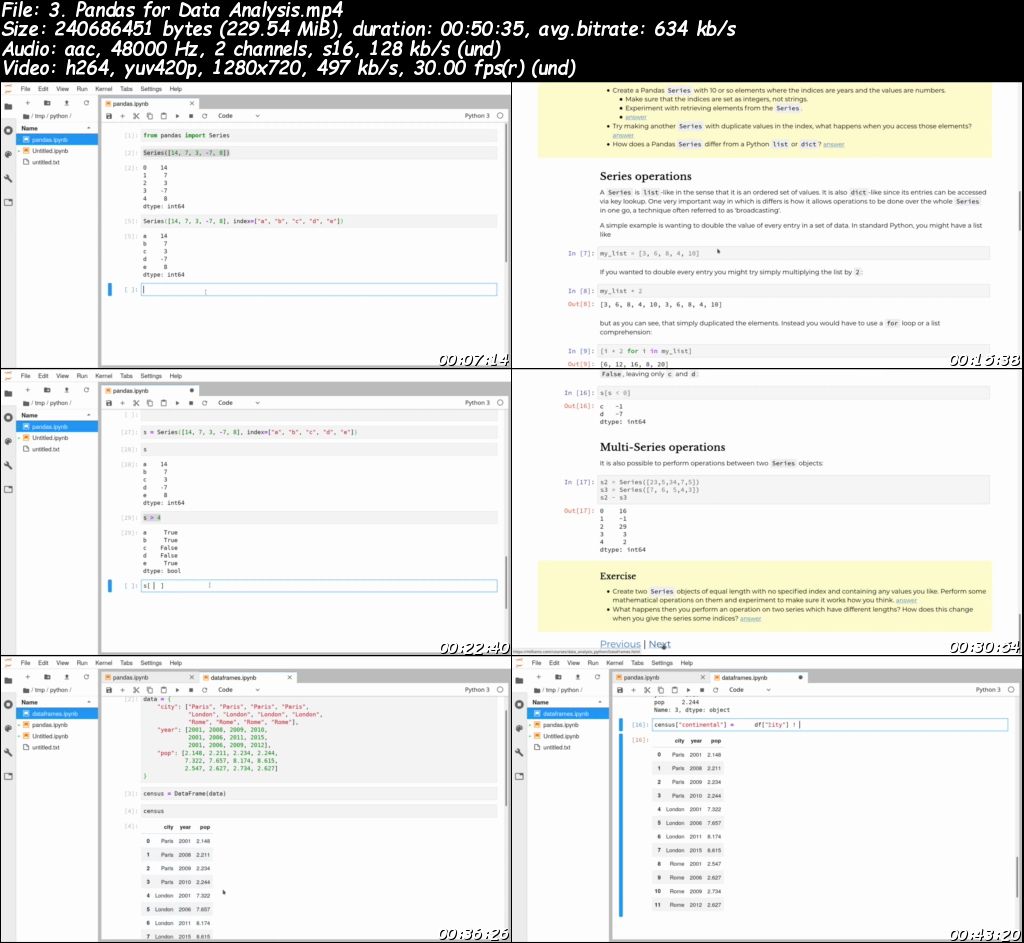
Video: .mp4 (1280x720, 30 fps(r)) | Audio: aac, 48000 Hz, 2ch | Size: 7.09 GB
Genre: eLearning Video | Duration: 53 lectures (20 hour, 41 mins) | Language: English
Video: .mp4 (1280x720, 30 fps(r)) | Audio: aac, 48000 Hz, 2ch | Size: 7.09 GB
Genre: eLearning Video | Duration: 53 lectures (20 hour, 41 mins) | Language: English
Learn complete Data Analysis, Data Science, Data Visualization & Data Analytics Python & Pandas become a data analytics
What you'll learn
Perform data operations like as grouping, pivoting, joining, and more with Python's popular "pandas" module.
Learn how to manipulate 1D, 2D, and 3D data sets
Discover hundreds of pandas methods and characteristics
Troubleshoot faulty or missing data sets
Learn to program in Python well.
You will learn about integer, float, logical, string, and other Python types.
Learn how to install packages in Python
Learn how to code in Jupiter Notebooks
Successfully perform all steps in a complex Data Science project
Learn to build statistical models, use Backward Elimination, Forward Selection, and Bidirectional Elimination techniques.
Create Basic Tableau Visualizations
Have an intermediate skill level of Python programming.
Use the numpy library to create and manipulate arrays.
Have a portfolio of many different data analysis projects.
Use the pandas module with Python to create and structure data.
Create data visualizations using matplotlib and the seaborn modules with python.
Description
Why Data Analysis?
As organizations seek to create insights and push their businesses forward with the assistance of data, the field of data analytics is expanding at a fast pace. Learn what data analytics is, why it is important, the many kinds of data analytics, and the numerous data analytics applications in this Data Analytics Complete Course. You will also learn how to use data analytics.
Why Enroll in our course?
9Hours Intense content
Full of practices and Hands on Projects
FREE Textbook
Community of Students and Experts
Udemy Certificate
30 Days Money Back Grantee
What will we do in the course?
We'll go through hundreds of various methods, characteristics, features, and functions that are hidden away inside this incredible library during this session. We'll delve into a slew of various datasets, both short and lengthy, broken and immaculate, in order to show the amazing flexibility and effectiveness of this tool.
Data Analysis with Pandas and Python comes includes a slew of sample datasets that you may experiment with. Explore Pandas from the beginning and follow along with my tutorials to discover how simple it is to get started with pandas!
The Data Analysis with pandas and Python course is an excellent introduction to one of the most powerful data toolkits available today, whether you're a novice data analyst or have spent years (*cough* far too long *cough*) in Microsoft Excel.
Topics:
Introduction to Python course
Intermediate Python- Functions, Modules, Classes and Exceptions
Introduction Data Analysis in Python
Applied Data Analysis in Python - Machine learning and Data science
In data analysis using python python's ability to create and manage data structures quickly, for example, is one of the most common applications of the language in data analysis — Pandas, for example, provides a plethora of tools for manipulating, analyzing, and even representing complex datasets — and this is one of the most common applications of Python in data analysis.
We had a team people editing and marketing the course, the editing was done by Mohammad Chowdhury and the marketing was done by Mohammad Fahmid Chowdhury.
The course was created by professors with years of Python experience. The course content was created by Matt Williams, he is a professor with years of Python and Data Science experience, under the CC Attribution license.
Attributions:
Editing: Mohammad Chowdhury
Music: from Bensound
Thumbnail: by Les Anderson on Unsplash
Content creator: Matt Williams from University of Bristol
Created under CC attribution license
Who this course is for:
Python, data science, and data visualization enthusiasts are all encouraged to apply.
All curious individuals who are interested in the fast growing field of data science!
Data Analysis, Data Science & Visualization: Python & Pandas