The complete D3.js Data Visualization Fundamentals

The complete D3.js Data Visualization Fundamentals
Video: .mp4 (1280x720, 30 fps(r)) | Audio: aac, 44100 Hz, 2ch | Size: 655 MB
Genre: eLearning Video | Duration: 20 lectures (1 hour, 56 mins) | Language: English
Leverage the power of D3.js to create beautiful and stunning illustrations of data
Video: .mp4 (1280x720, 30 fps(r)) | Audio: aac, 44100 Hz, 2ch | Size: 655 MB
Genre: eLearning Video | Duration: 20 lectures (1 hour, 56 mins) | Language: English
Leverage the power of D3.js to create beautiful and stunning illustrations of data
What you'll learn
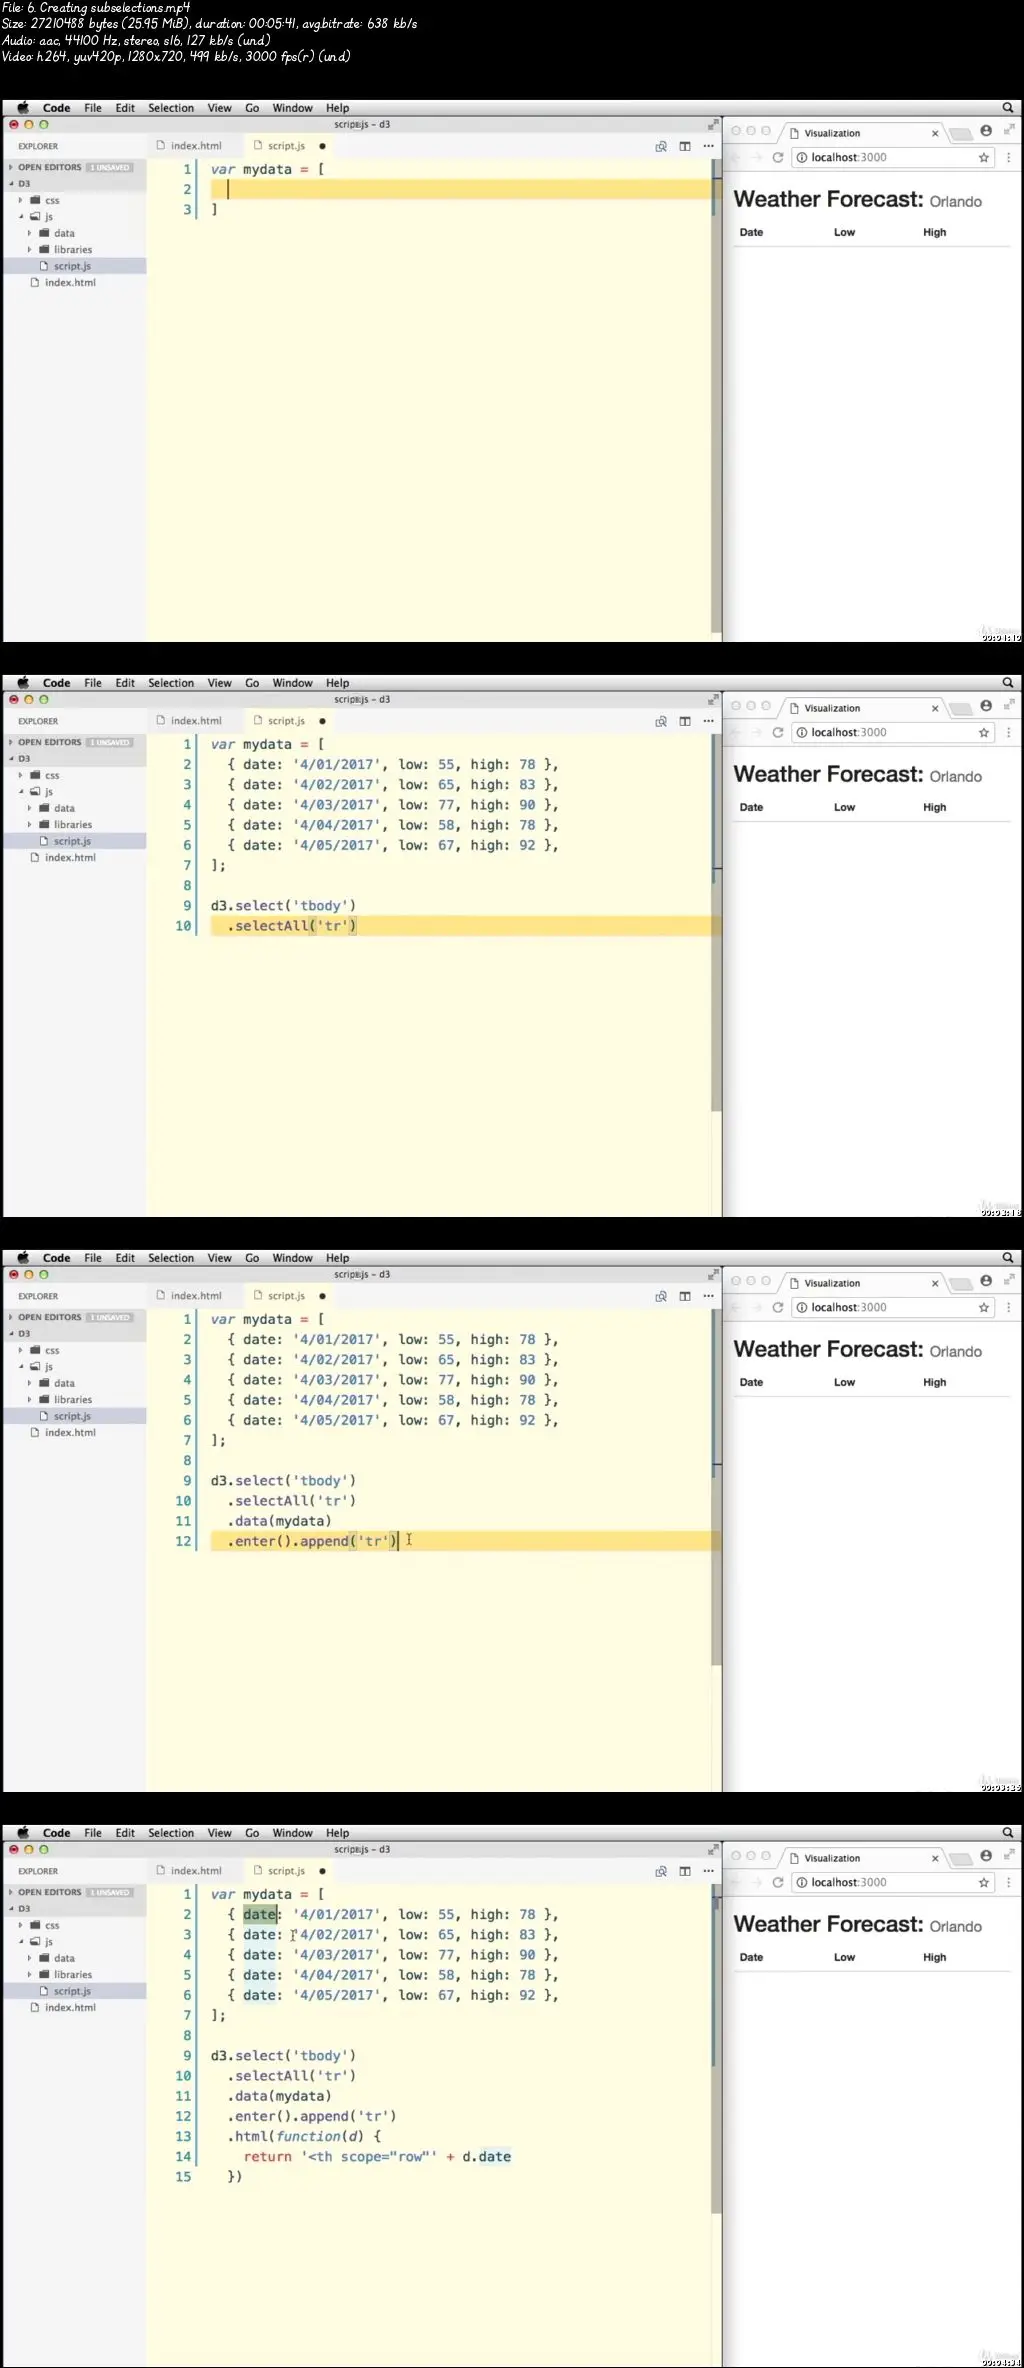
Learn the enter-update-exit pattern for representing data visually in D3_js
Learn all about the transition and animation support provided by D3_js
Requirements
Have a basic understanding of HTML, CSS and JavaScript
Description
Need to get your hands dirty with D3.js quickly?
Start learning all you needed to know about creating beautiful data visualizations with Packt’s Learning Path, D3.js: Visualizing Data with D3.js.
This Learning Path seeks to take you on a journey to learn to create beautiful visualizations of information using D3.js. D3.js, where D3 stands for data-driven documents, is an amazing JavaScript library which is known among data analysts, engineers, mathematicians, and developers worldwide as an advanced data visualization tool. Its ability to bring data to life in the form of graphics is what has made it so widespread in its use, scope, and popularity.
D3.js has revolutionized the way data is analyzed, making it far easier than before to gain useful insights from complex, yet highly lucid data visualizations. With an extensive library equipped to help you create a huge variety of plots, charts, and graphs, D3.js is currently one of the best tools to help you create attractive and intuitive data visualizations.
D3.js: Visualizing Data with D3.js is Packt’s Video Learning Path that is a series of individual video products put together in a logical and stepwise manner such that each video builds on the concepts mastered in the video before it.
First, we would be looking at understanding the basics of D3.js. Then, we would move on to aspects such as setting up some of our very first data visualizations, including learning ways to bind the data to the DOM and applying custom, data-driven transformations to it to create stunning infographics. Further, we would be learning to harness the power of the recently released D3 v4 API. Finally, we would be looking at some of the techniques to create data visualizations using the animation and transition support provided by the D3 library.
Who this course is for:
Anyone who wants to understand the D3 core and create data visualizations.
The complete D3.js Data Visualization Fundamentals