Microsoft Excel Charts, Graphs and Data Visualization

Microsoft Excel Charts, Graphs and Data Visualization
Video: .mp4 (1280x720, 30 fps(r)) | Audio: aac, 44100 Hz, 2ch | Size: 2.14 GB
Genre: eLearning Video | Duration: 55 lectures (4 hours, 40 mins) | Language: English
Video: .mp4 (1280x720, 30 fps(r)) | Audio: aac, 44100 Hz, 2ch | Size: 2.14 GB
Genre: eLearning Video | Duration: 55 lectures (4 hours, 40 mins) | Language: English
Master 20+ Advanced Dynamic Excel Charts and Create Impressive Graphs & Data Visualization in Microsoft Excel.
What you'll learn
Create designer-quality Charts in Microsoft Excel with real-world examples. BONUS: Excel Workbook files + Sample files included
Improve general Excel knowledge
Learn from an instructor with over 16 years of experience with Microsoft Excel, teaching thousands of students in his own computer learning school
Learn the most current version of Microsoft Excel 2013
Learn through quizzes and exercises
Requirements
This course was recorded with Excel 2013 but it's also compatible also with Excel 2016, 2007 and 2010
It is also compatible with Microsoft Office for Mac
Only basic prior experience in Excel 2013 or spreadsheets is required to get the most out of this Excel course
Description
Have you wasted your time searching countless hours for YouTube videos, trying to find useful content about Excel Dynamic Charts? What if you could learn how to make designer-quality Excel Charts and Graphs in a few hours?
Think about what your Excel charts look like if you could follow a concise and practical go-to guide course for creating Advanced Graphs and Data Visualizations in Excel.
While Excel offers dozens of chart types and hundreds of formatting options, making the right Chart is tough. The adage "A picture is worth a thousand words" is also related to Excel Charts. A good Chart can clearly tell the story in your data.
What this course is about:
In this course my goal is to give my students the practical knowledge, with real-world examples and step by step instructions, to create designer-quality Charts in Excel.
As a bonus I've included all the Excel Templates plus Sample Files plus Cheat Sheets for every section.
You'll have lifetime access to watch the videos whenever you like. If you're not 100% satisfied there is a 30 day money back guarantee!
Plus you will get fast and responsive support within 24 hours.
Here is what you'll get:
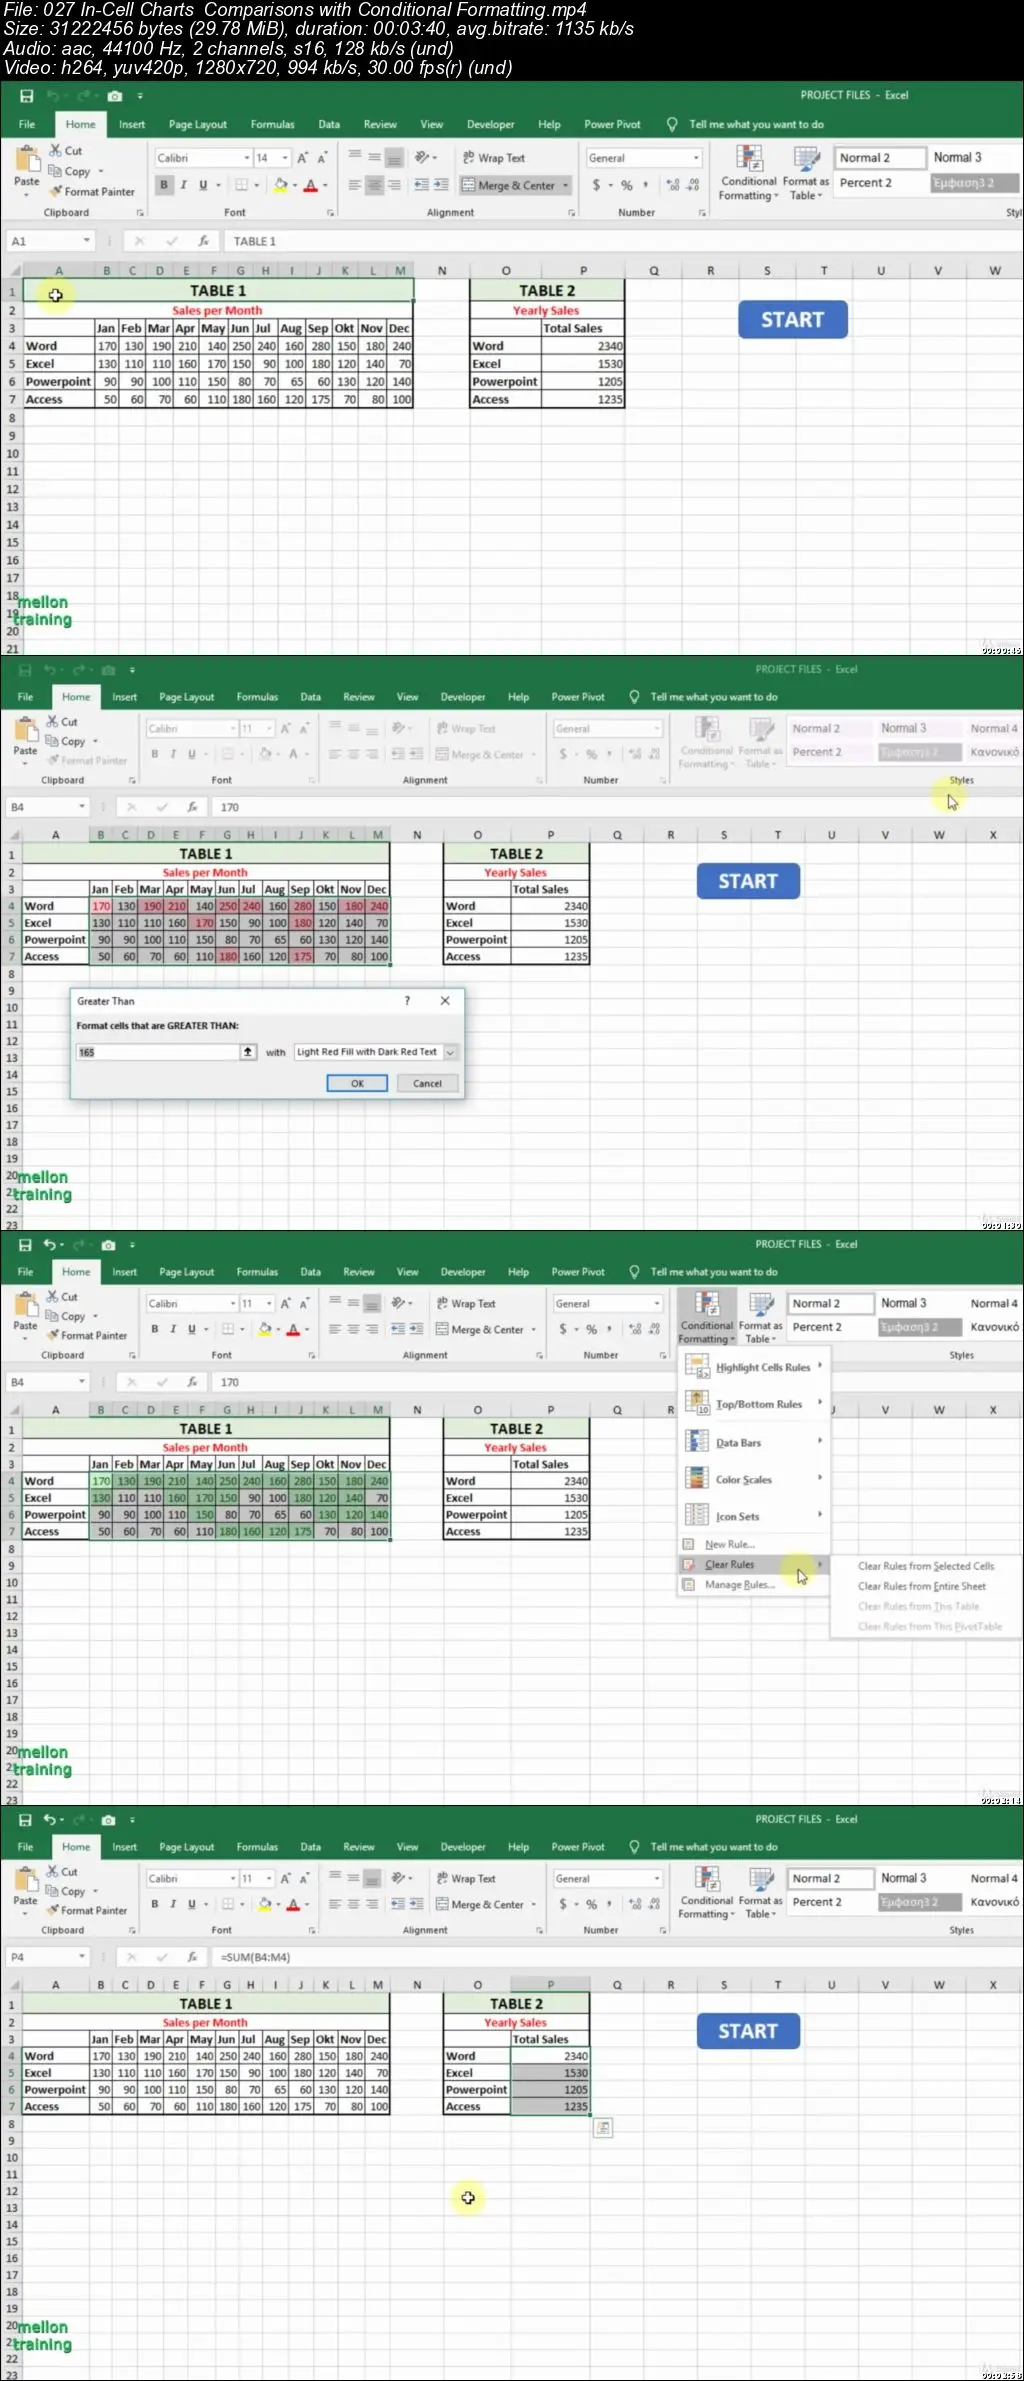
How to select the correct Excel chart type for your data.
The most important elements of a Microsoft Excel chart, like chart and plot area, Design and Format tab, data labels, gridlines, legends, titles, axes, layouts and much more
Modifying an Excel Graph visually: styles and colors, create a pictograph, shapes, effects, text etc.
Basic Excel Charts like Column charts, Bar charts, Pie charts, Line charts.
Advanced Excel Charts like Speedometer, Pareto, Gantt, Thermometer and Bullet Chart
Updating and printing charts
Bonus material: Excel templates + Sample files + cheat sheets
Bonus Lecture : Excel most useful shortcuts etc
Only basic prior experience in Microsoft Excel or Spreadsheets is required to get the most out of this Excel course.
At the end of this Microsoft Excel class you will be given a Certificate of Completion.
So what are you waiting for? Begin creating the kind of charts you want and enroll now!
Thank you and I'll see you inside the course.
Who this course is for:
Excel users who wants to learn how to create Excel Charts
Students with a willingness for learning
Business Professionals + Entrepreneurs
Microsoft Excel Charts, Graphs and Data Visualization