Data Visualizations using Python with Data Preparation

Data Visualizations using Python with Data Preparation
.MP4 | Video: 1280x720, 30 fps(r) | Audio: AAC, 44100 Hz, 2ch | 772 MB
Duration: 1.5 hours | Genre: eLearning Video | Language: English
Data Visualization using Python
.MP4 | Video: 1280x720, 30 fps(r) | Audio: AAC, 44100 Hz, 2ch | 772 MB
Duration: 1.5 hours | Genre: eLearning Video | Language: English
Data Visualization using Python
What you'll learn
Applied Statistics using Python
Requirements
Fundamentals Python programming
Description
This is the bite size course to learn Python Programming for Data Visualization. In CRISP DM data mining process, Data Visualization is at the Data Understanding stage. This course also covers Data processing, which is at the Data Preparation Stage.
You will need to know some Python programming, and you can learn Python programming from my "Create Your Calculator: Learn Python Programming Basics Fast" course. You will learn Python Programming for applied statistics.
You can take the course as follows, and you can take a exam at EMHAcademy to get SVBook Certified Data Miner using Python certificate :
- Create Your Calculator: Learn Python Programming Basics Fast (R Basics)
- Applied Statistics using Python with Data Processing (Data Understanding and Data Preparation)
- Advanced Data Visualizations using Python with Data Processing (Data Understanding and Data Preparation, in future)
- Machine Learning with Python (Modeling and Evaluation)
Content
Getting Started
Getting Started 2
Getting Started 3
Data Mining Process
Download Data set
Read Data set
Bar Chart
Histogram
Line Chart
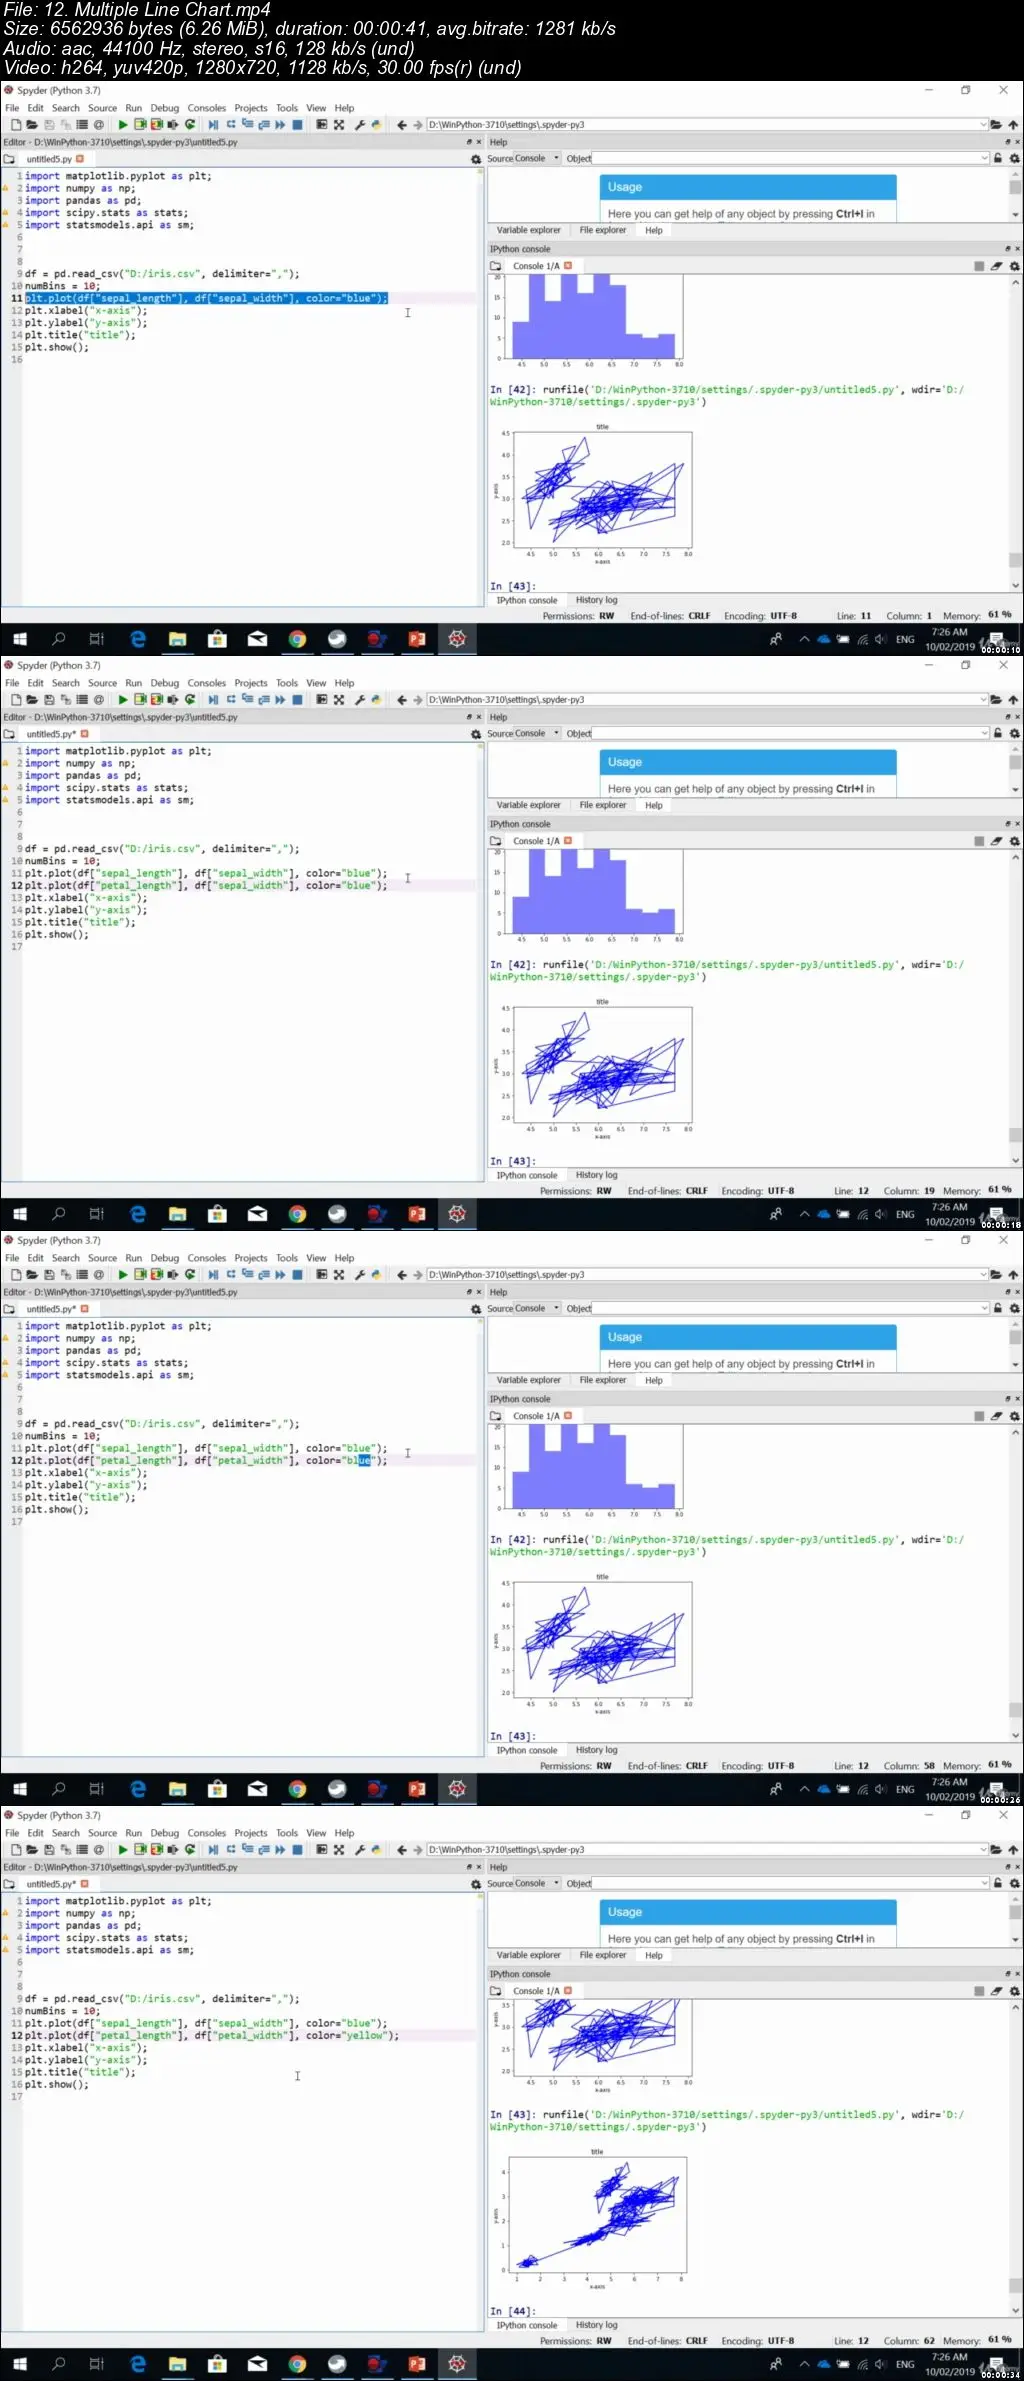
Multiple Line Chart
Pie Chart
Box Plot
Scatterplot
Scatterplot Matrix
Save To Image
Bar Chart with Seaborn
Histogram with Seaborn
Line Chart with Seaborn
Scatterplot with Seaborn
Categorical PLot with Seaborn
Boxplot with Seaborn
Scatterplot Matrix with Seaborn
Save To Image
Interactive Charts
Interactive Charts
Interactive Charts
Interactive Charts
Data Processing: DF.head()
Data Processing: DF.tail()
Data Processing: DF.describe()
Data Processing: Select Variables
Data Processing: Select Rows
Data Processing: Select Variables and Rows
Data Processing: Remove Variables
Data Processing: Append Rows
Data Processing: Sort Variables
Data Processing: Rename Variables
Data Processing: GroupBY
Data Processing: Remove Missing Values
Data Processing: Is THere Missing Values
Data Processing: Replace Missing Values
Data Processing: Remove Duplicates
Who this course is for:
Beginner Data Scientist or Analyst interested in Python programming
Data Visualizations using Python with Data Preparation