Introduction to Data Visualization with ggplot2

Introduction to Data Visualization with ggplot2
MP4 | Video: AVC 1280x720 | Audio: AAC 44KHz 2ch | Duration: 1 Hour | 292 MB
Genre: eLearning | Language: English
MP4 | Video: AVC 1280x720 | Audio: AAC 44KHz 2ch | Duration: 1 Hour | 292 MB
Genre: eLearning | Language: English
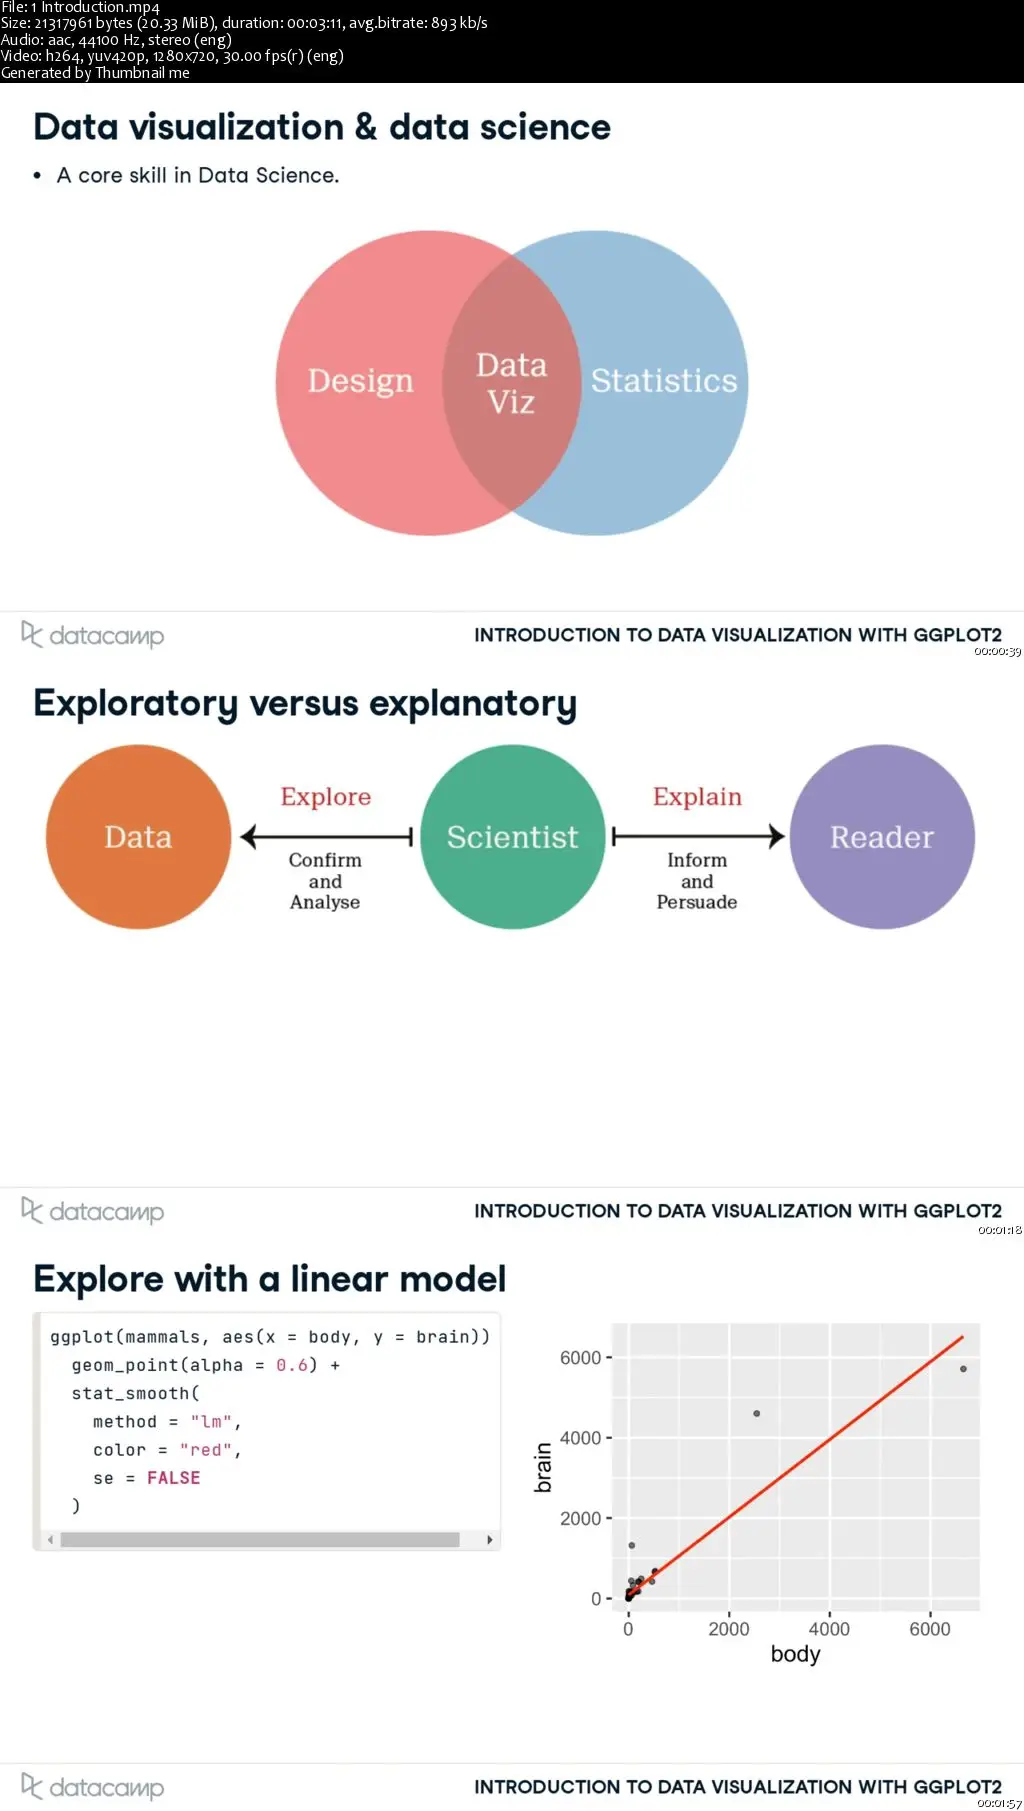
The ability to produce meaningful and beautiful data visualizations is an essential part of your skill set as a data scientist. This course, the first R data visualization tutorial in the series, introduces you to the principles of good visualizations and the grammar of graphics plotting concepts implemented in the ggplot2 package. ggplot2 has become the go-to tool for flexible and professional plots in R. Here, we’ll examine the first three essential layers for making a plot - Data, Aesthetics and Geometries. By the end of the course you will be able to make complex exploratory plots.

Introduction to Data Visualization with ggplot2