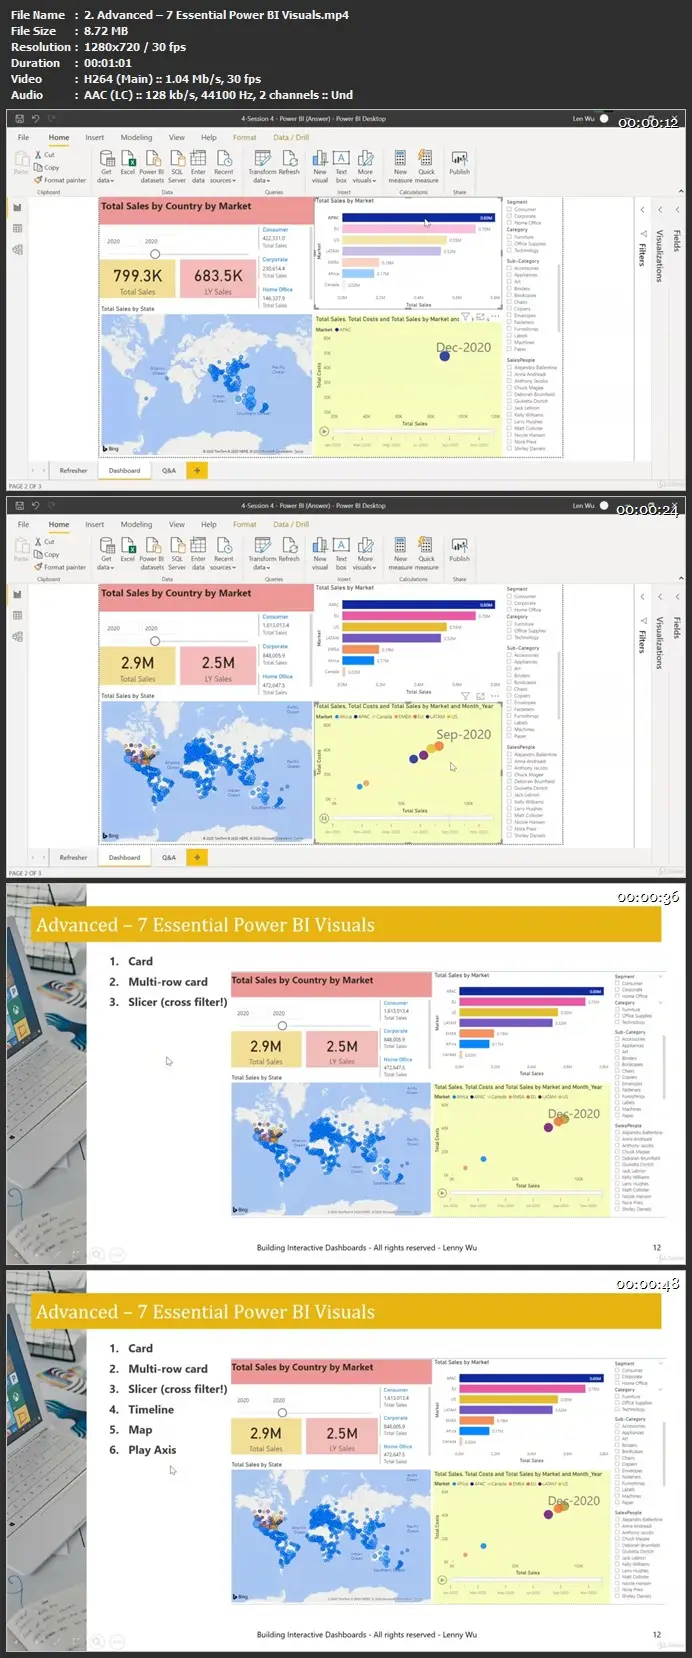
Power BI - Building Interactive Dashboards

Power BI - Building Interactive Dashboards
Duration: 1h 3m | .MP4 1280x720, 30 fps(r) | AAC, 44100 Hz, 2ch | 436 MB
Genre: eLearning | Language: English
Duration: 1h 3m | .MP4 1280x720, 30 fps(r) | AAC, 44100 Hz, 2ch | 436 MB
Genre: eLearning | Language: English
A combination of Power Query, Power Pivot, Power View, and Power Map!
What you'll learn
This course will help you
to have awareness of the fastest growing BI program, bar none
to refresh on data transformation concepts in Power Query and data analysis skills in Power Pivot
to learn how to build from scratch a stunning Power BI dashboard
to learn about the best practices in Power BI modeling
to incorporate the Artificial Intelligence function into your dashboard
to be well positioned for building the shareable “on-demand” Power BI dashboards
Requirements
Some background using Power Query and/or Power Pivot in Excel is preferred.
Example: be able to connect to external files and load to Power Query and/or Power Pivot.
Description
In the 2010s, we used to have the Excel Add-ins to perform simple data transformation (Power Query), data modeling and analysis (Power Pivot), and data visualizations (Power View, and Power Map). I called them the “Power Suite”.
Then a bottleneck was reached, as the largest rows of data allowed in Excel is 1 million rows, and you would be out of luck if you extract tens of, or hundreds of millions of rows of data you want to analyze.
Now in July 2015, a completely new but powerful platform was born that incorporated all the tools in the “Power Suite” as I called. It exists independent of Microsoft Excel and yet allows for hundreds of millions or even more data rows to process in a shorter period of time. This means that people do not have to own Excel in order to use Power BI.
And the biggest win is that it is FREE! Seriously, it is free! Microsoft only charges nominal monthly fees for sharing dashboards online.
So what are you waiting for?! Let’s see what Power BI, equipped with all of the 4 components of the “Power Suite”, can do for us!
Did I mention that Power BI is the first dashboard software to incorporate Artificial Intelligence to create visuals or charts for you when all you need is to type English words telling it what to chart??!!
Who this course is for:
Students (Secondary or post secondary), Office workers, Professionals, and Managers
More Info
Power BI - Building Interactive Dashboards