
Start Data Science with Numpy, Pandas, Matplotlib & Seaborn

Start Data Science with Numpy, Pandas, Matplotlib & Seaborn
Video: .mp4 (1280x720, 30 fps(r)) | Audio: aac, 48000 Hz, 2ch | Size: 732 MB
Genre: eLearning Video | Duration: 3 hours | Language: English
Video: .mp4 (1280x720, 30 fps(r)) | Audio: aac, 48000 Hz, 2ch | Size: 732 MB
Genre: eLearning Video | Duration: 3 hours | Language: English
Python, Data Analysis, Visualization. Covers essential python topics and libraries for Data Science or Machine Learning.
What you'll learn
Installing anaconda
Launching jupyter
Hands on skills in Data Insights Visualization
Basic Python- Creating Identifiers, Operators, Decision Controls, Loops
Collections - List, Set, Dictionaries, Tuples
Numerical Python - 1 to Multidimensional array and Operations and more.
Pandas DataFrames - Intruduction and Operations and more
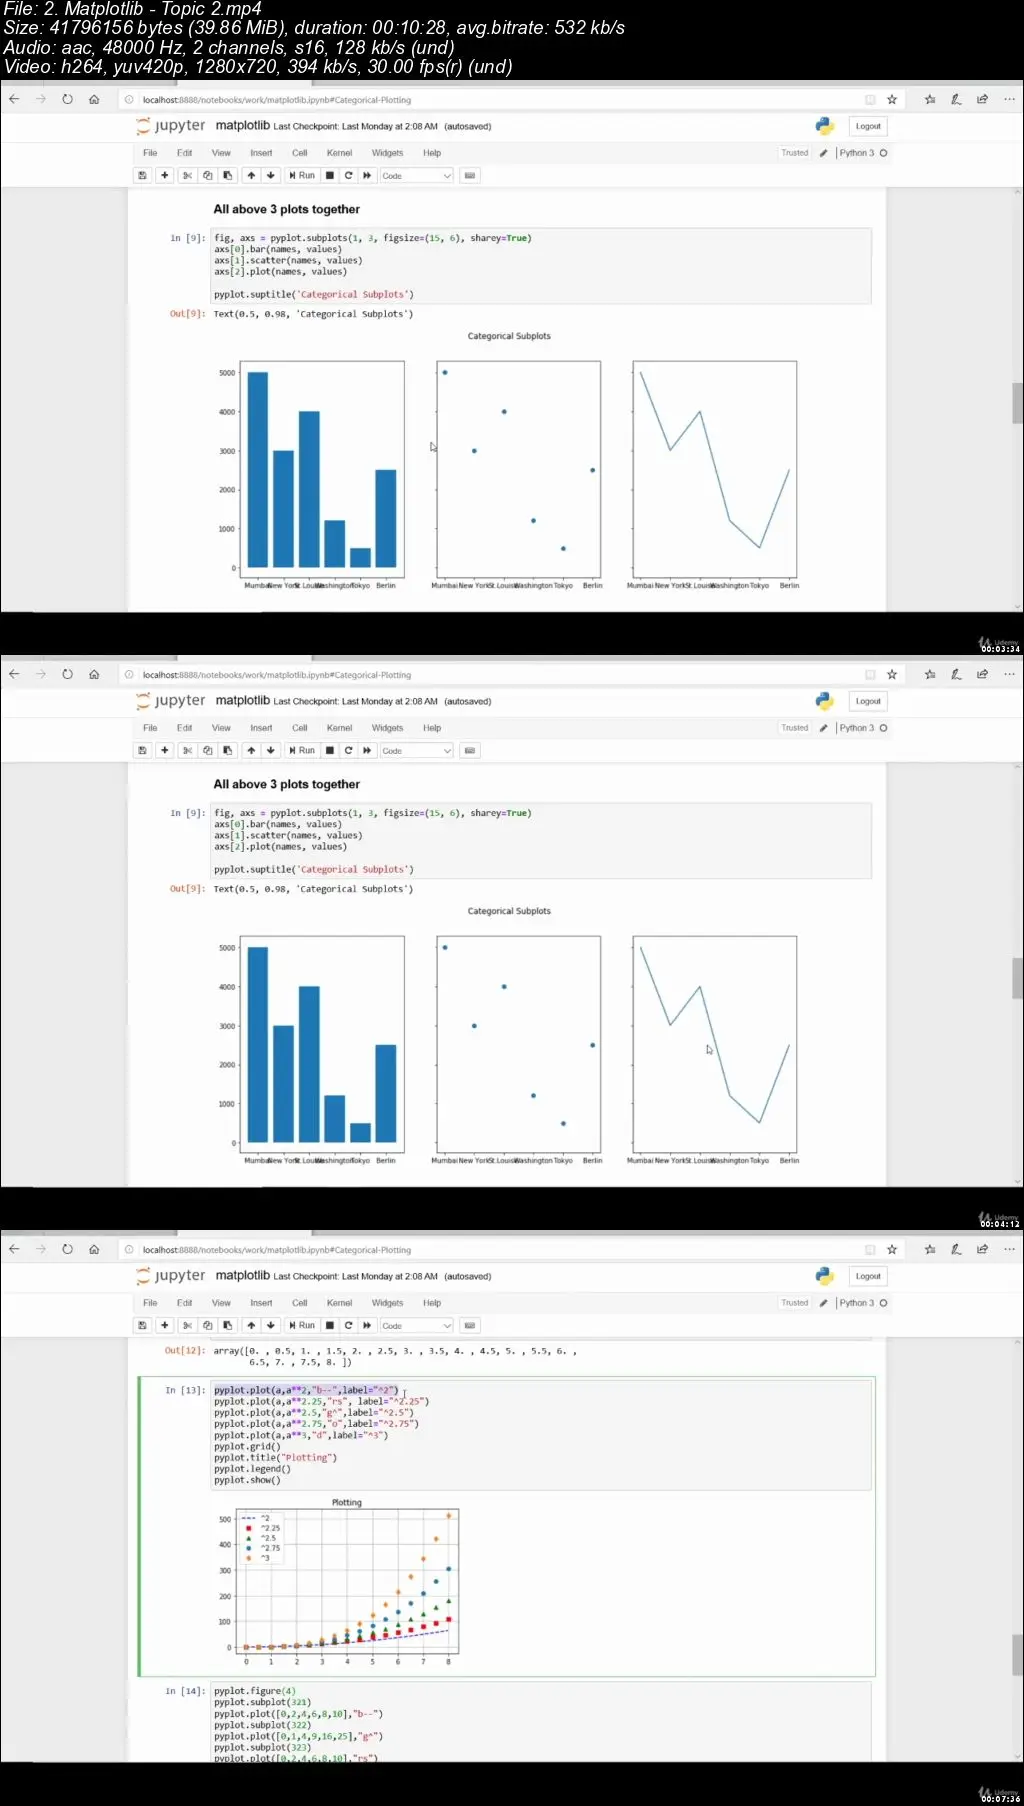
Visual plots such as line, bar, scatter, histogram etc.
Matplotlib for basic visualizations to retrieve meaningful insights
Seaborn for basic visualizations to retrieve meaningful insights
Case Study to visualize meaningful insights
and more !
Requirements
No programming knowledge required. I'll teach you.
No need not be intelligent in mathematics. I'll cover wherever required.
You just need computer or mobile phone with internet connection to access course material.
Description
Lets learn basics to transform your career.
I promise not to exhaust you with huge number of videos.
Welcome to the most comprehensive Data Analysis and Insights Visualization course! An excellent choice for beginners and professionals looking to expand their knowledge on one of the most popular Python libraries in the world such as collections, numerical pyhton, matplotlib, seaborn and pandas data frames. This course includes case study for drawing meaningful insights out of given business data.
Start Data Science with Numpy, Pandas, Matplotlib & Seaborn course offers video tutorials on the most powerful data analysis toolkit available today.
Why learn Data Analysis and Insights Visualization using Python?
If you've spent time in a spreadsheet software like Microsoft Excel, Google Sheets or any form of tabular data such as database tables, delimited files or csv files and are eager to take your data analysis skills to the next level using python, this course is for you!
Numerical Python is a powerful library which efficiently performs matrix operations faster and exceed the python capabilities of data processing.
Pandas is a powerhouse tool that allows you to do anything and everything with tabular or columnar data sets – analyzing, organizing, sorting, filtering, aggregating, cleaning, calculating, and more!
Matplotlib is an amazing visualization library in Python for 2D plots of arrays. Matplotlib is a multi-platform data visualization library built on NumPy arrays. One of the greatest benefits of visualization is that it allows us visual access to huge amounts of data in easily digestible visuals. Matplotlib consists of several plots like line, bar, scatter, histogram etc.
Seaborn is a library for making statistical graphics in Python. It is built on top of matplotlib and closely integrated with pandas data structures.
Whether you're a new data analyst, planning to transit yourself to data analyst role or have spent years in Excel, Data Analysis and Meaningful insights course offers you an incredible introduction to one of the most powerful data tool kits available today!
Who this course is for:
Anyone who want to start with Data Science in short period of time.
Anyone who want to up skill then into Data Science
Managers who want to up skill them for high paying data jobs
Production Support Engineers who want to up skill them
Beginner python developer curious about data visualization
Data analysts, Business Analysts
Anyone who want to up skill them for high paying data jobs
Start Data Science with Numpy, Pandas, Matplotlib & Seaborn