


Creating Interactive Charts with HTML5
Creating Interactive Charts with HTML5
MP4 | Video: 720p | Duration: 1:07:28 | English | Subtitles: VTT | 204.0 MB
MP4 | Video: 720p | Duration: 1:07:28 | English | Subtitles: VTT | 204.0 MB
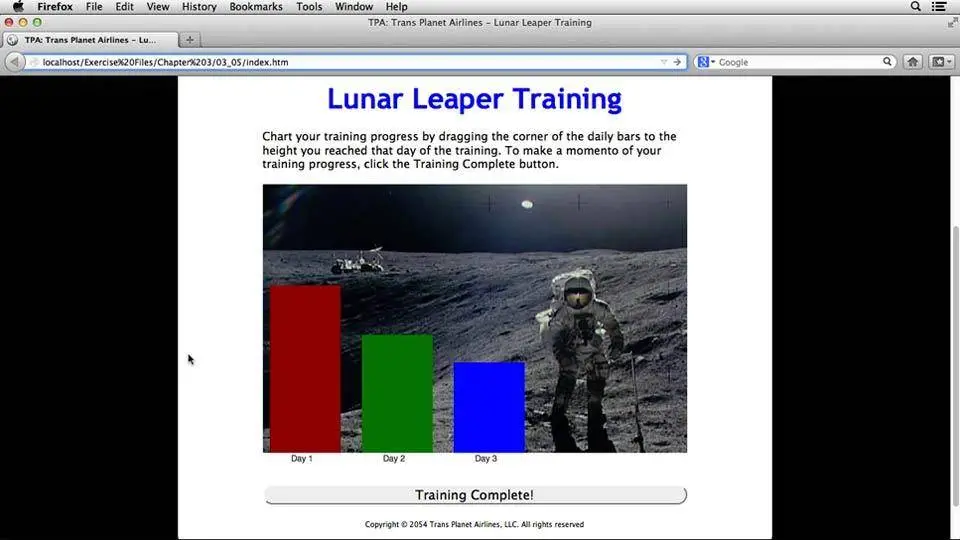
Spice up dry data presentations with interactive and visually engaging charts. This installment of HTML5 Projects shows how to build interactive bar charts, dynamically drawn with HTML5 Canvas. The user-friendly chart elements allow visitors to record different data scenarios by dragging bars. Author Joseph Lowery also shows how to automatically save the data from day to day. Altogether, this course offers a great introduction to HTML5 form elements with Canvas, integrated drag and drop, and local storage technologies.
Topics include:
- Crafting the HTML
- Initializing the stage
- Adding a legend and labels
- Drawing the bars in the bar chart
- Adding anchors for interactivity
- Connecting the feedback
- Storing user progress