Build an Interactive Business KPI Dashboard with Power BI (Guided Project)

Build an Interactive Business KPI Dashboard with Power BI (Guided Project)
.MP4, AVC, 1280x720, 30 fps | English, AAC, 2 Ch | 42m | 114 MB
Instructor: Aaron Parry
.MP4, AVC, 1280x720, 30 fps | English, AAC, 2 Ch | 42m | 114 MB
Instructor: Aaron Parry
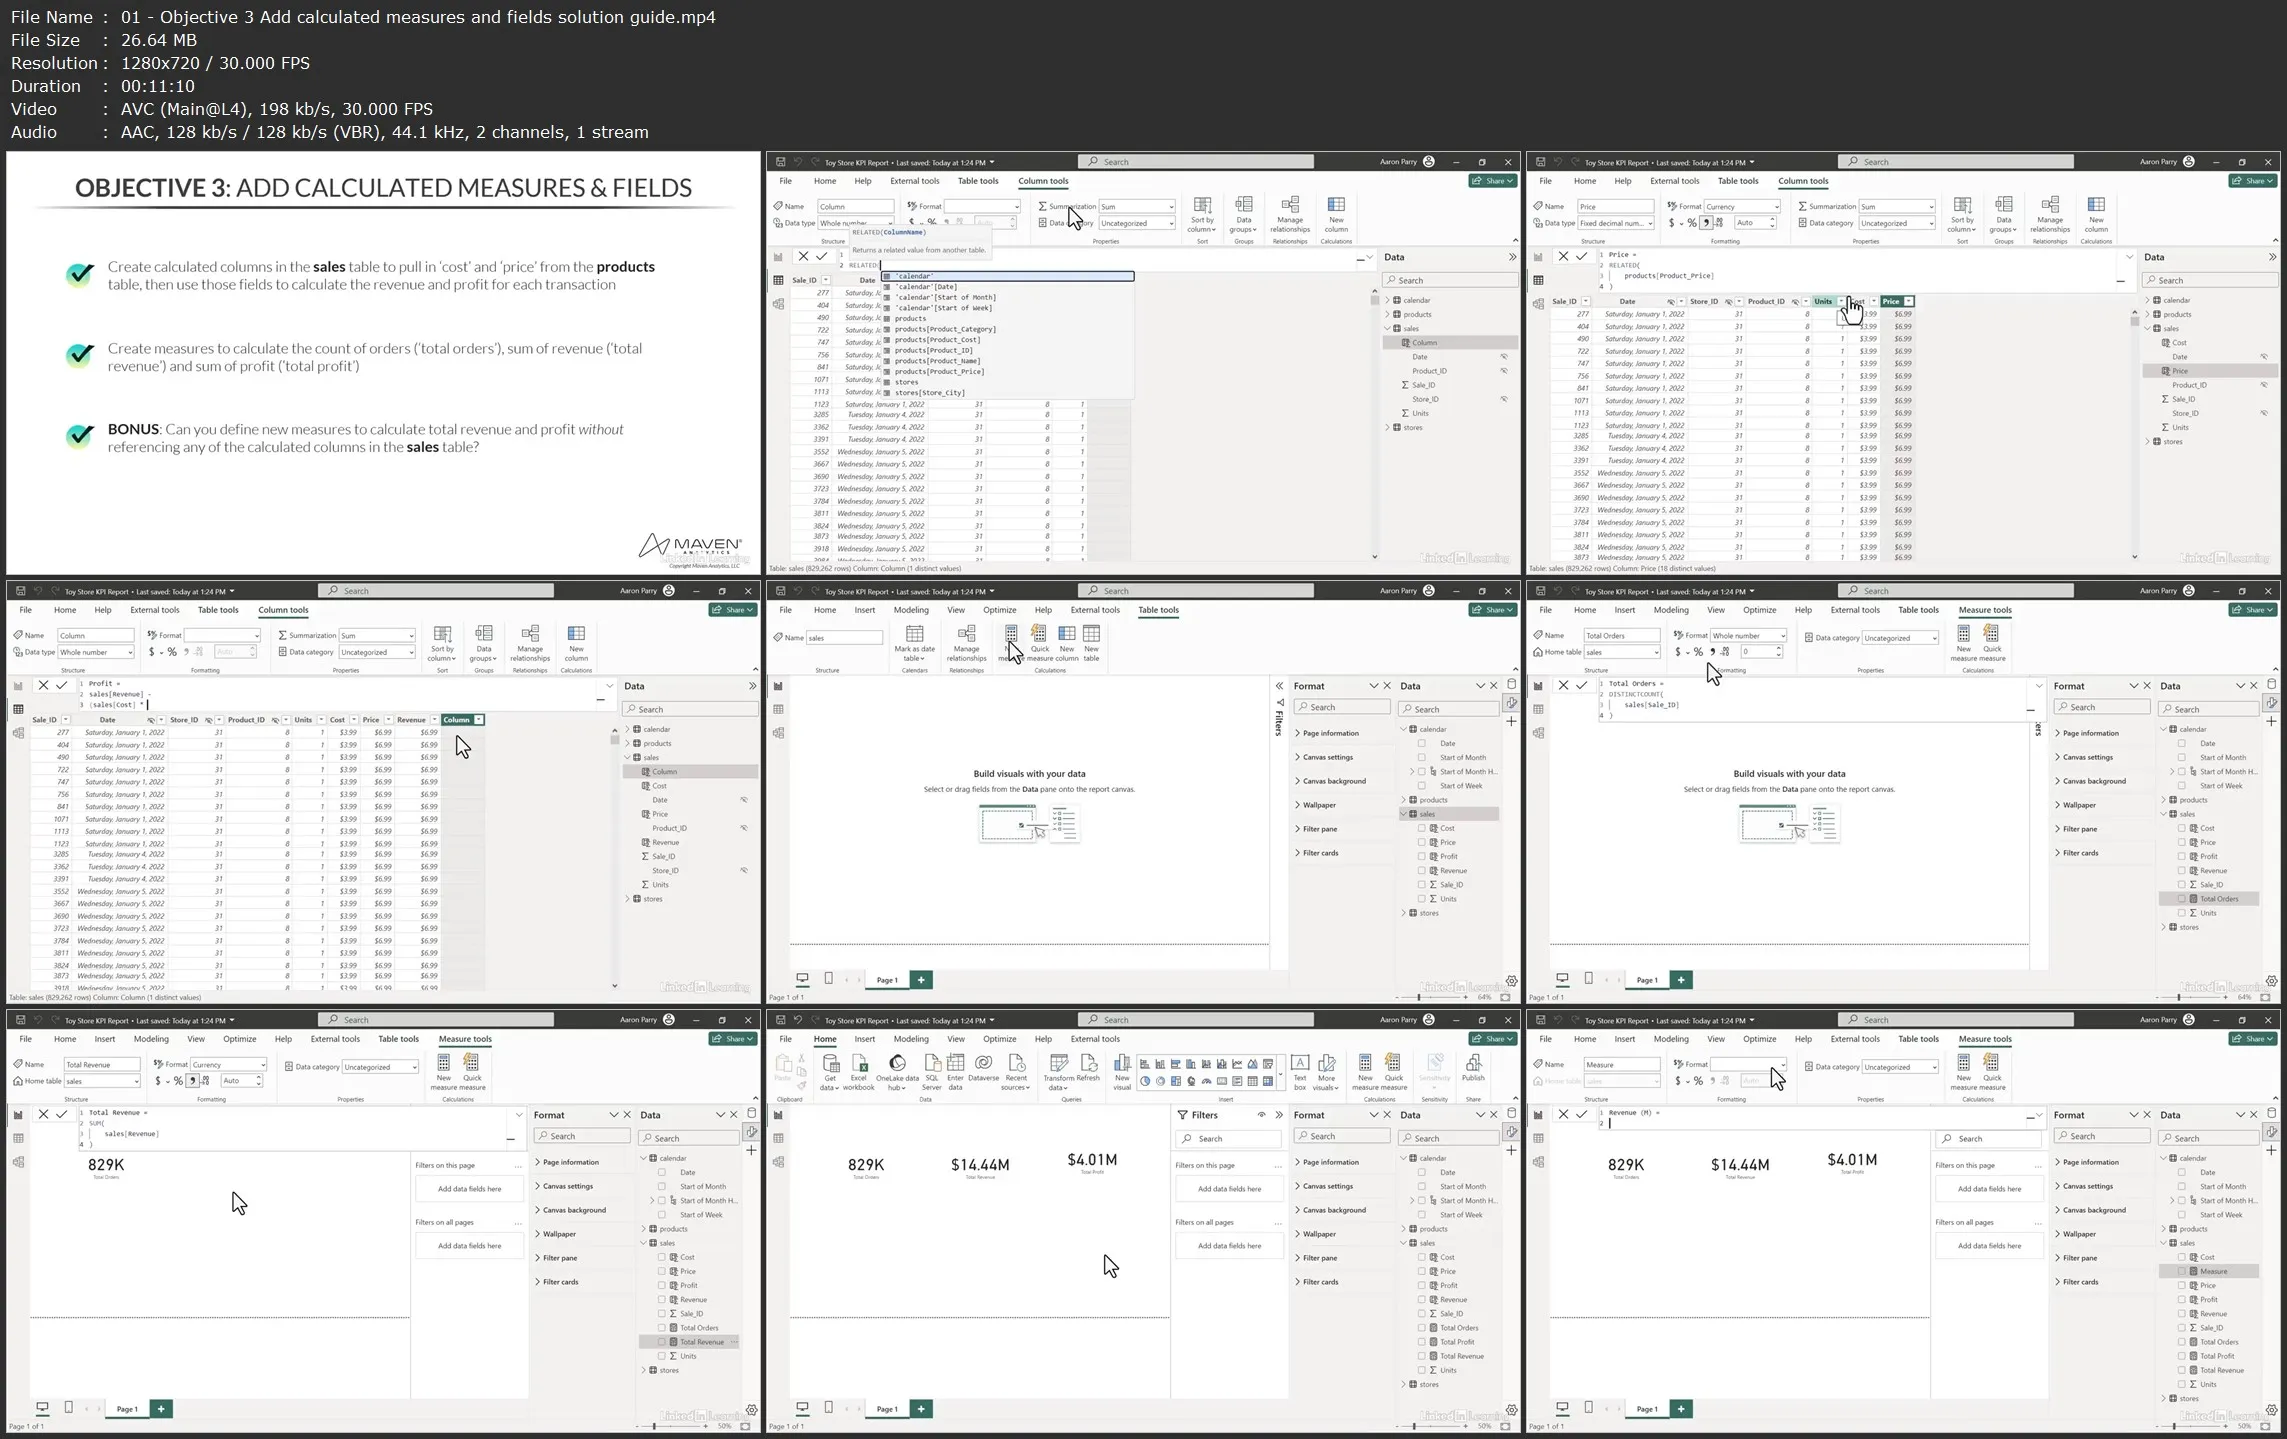
In this course, Aaron Parry—Chief Customer Officer at Maven Analytics—shows you how to build a simple, interactive KPI report to track key metrics and explore high-level trends. Learn how to connect and profile the data as you connect to the source data files, conduct basic profiling and QA tasks, and familiarize yourself with the tables and fields you'll use in this project.
Find out how to create a relational model by defining relationships between fact and dimension tables, creating simple hierarchies, and adjusting model properties. Explore ways to enhance the data model and prepare for analysis by defining new measures and calculated fields. Plus, put what you’ve learned to use as you visualize the data and create an interactive report that shows orders, revenue, and profit over time and by product category.
Build an Interactive Business KPI Dashboard with Power BI (Guided Project)