D3.js: Visualizing Data with D3.js
D3.js: Visualizing Data with D3.js
MP4 | Video: AVC 1280x720 | Audio: AAC 44KHz 2ch | Duration: 2 Hours 11M | 551 MB
Genre: eLearning | Language: English
MP4 | Video: AVC 1280x720 | Audio: AAC 44KHz 2ch | Duration: 2 Hours 11M | 551 MB
Genre: eLearning | Language: English
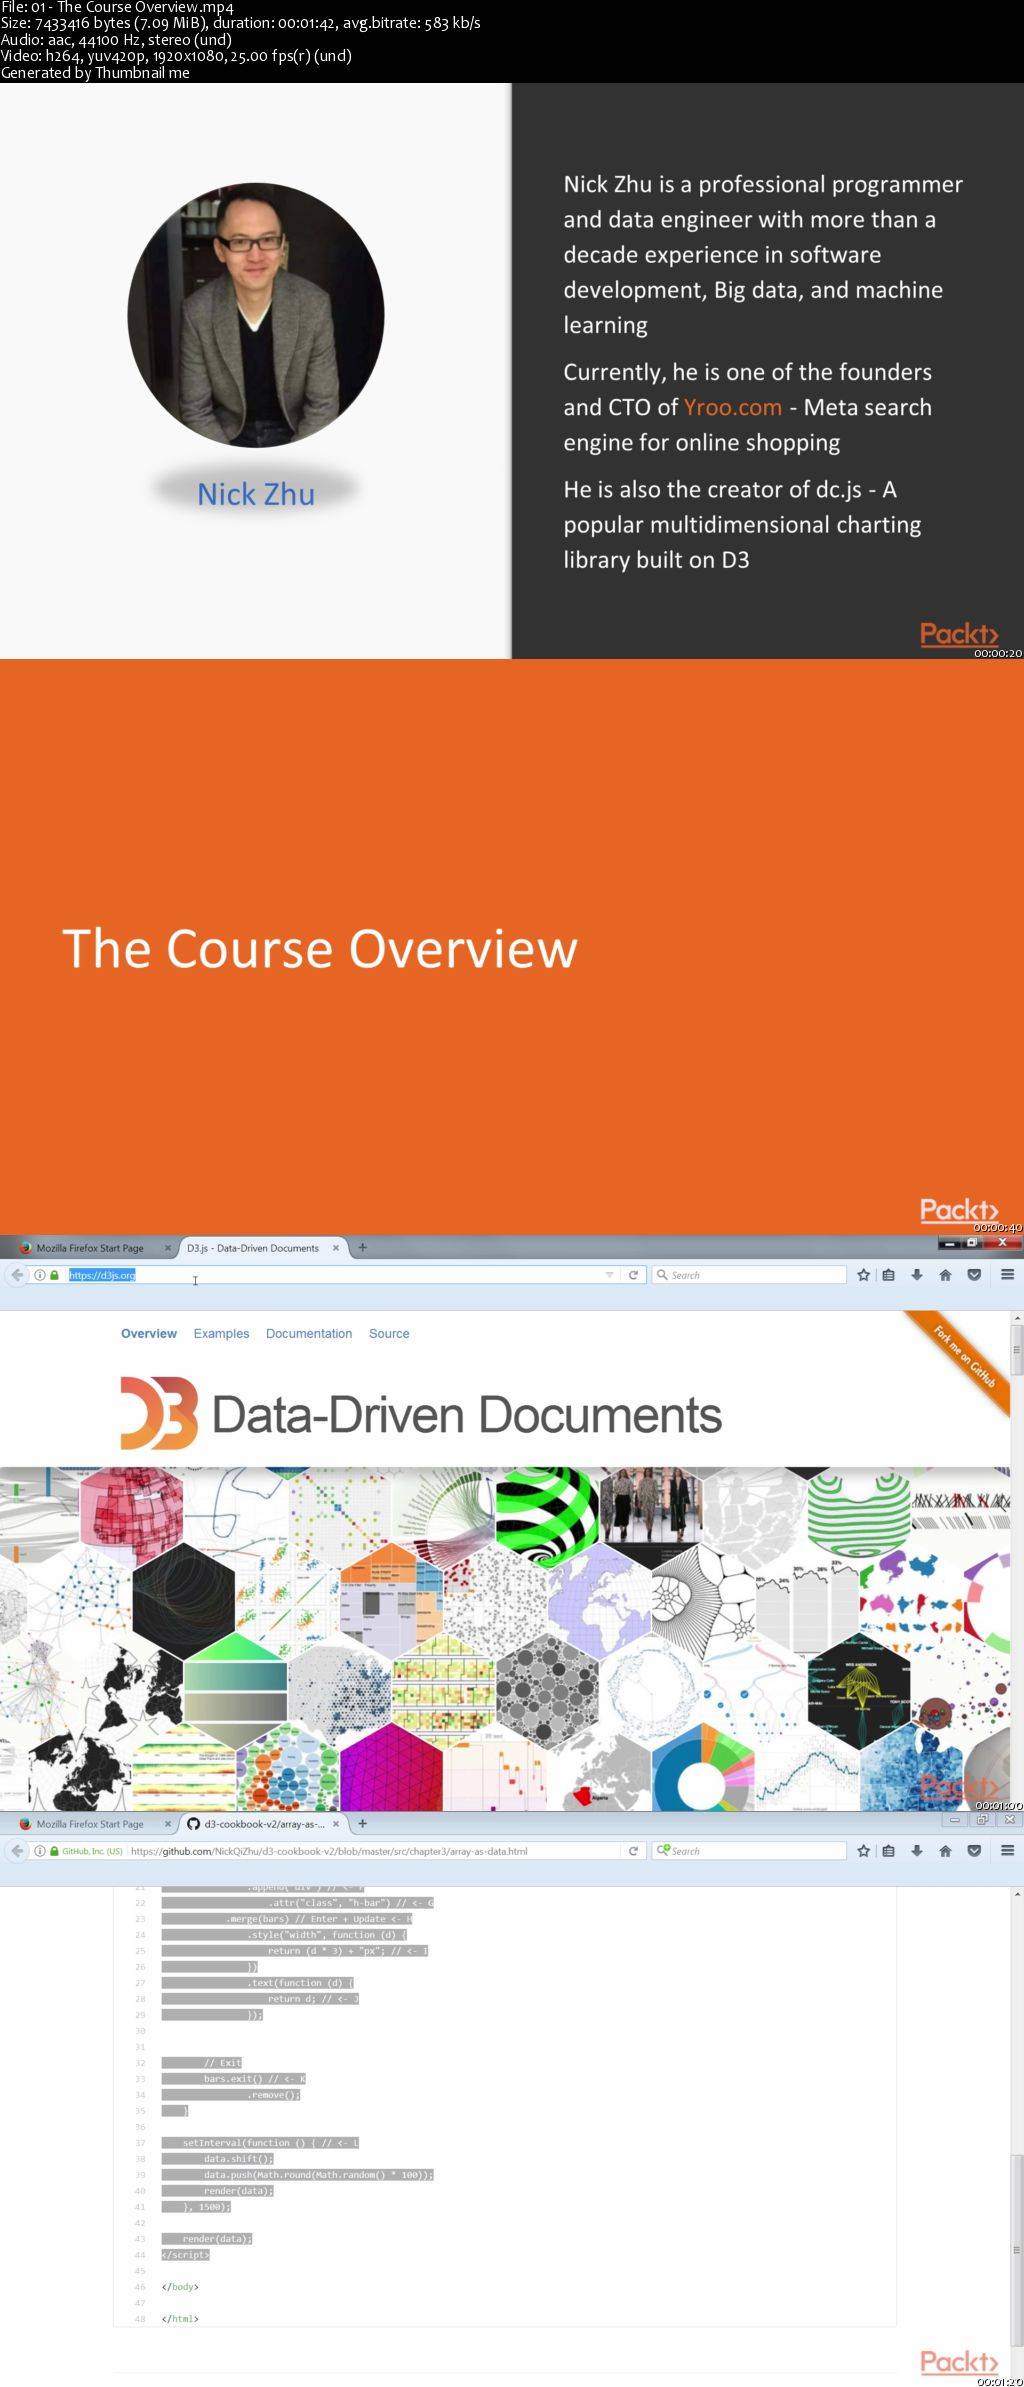
This Learning Path seeks to take you on a journey to learn to create beautiful visualizations of information using D3.js. D3.js, where D3 stands for data-driven documents, is an amazing JavaScript library which is known among data analysts, engineers, mathematicians, and developers worldwide as an advanced data visualization tool. Its ability to bring data to life in the form of graphics is what has made it so widespread in its use, scope, and popularity.
First, we would be looking at understanding the basics of D3.js. Then, we would move on to aspects such as setting up some of our very first data visualizations, including learning ways to bind the data to the DOM and applying custom, data-driven transformations to it to create stunning infographics. Further, we would be learning to harness the power of the recently released D3 v4 API. Finally, we would be looking at some of the techniques to create data visualizations using the animation and transition support provided by the D3 library.
By the end of this Learning Path, you will have developed a strong foundation in D3.js and would be able to create breathtaking visualizations of data using its vast library.
D3.js: Visualizing Data with D3.js